Energy Markets Update
In this newsletter, we cover the factors you need to know impacting US energy markets as well as the upcoming solar eclipse, LNG cargo international trends, promising electrical building codes that were recently struck down, and an explainer on electricity market designs.
Table of Contents
- Gas & Power Update
- US LNG Export Trends
- Promising Electric Building Regulations Defeated
- Energy Education Series: Nodal vs Zonal Market Design
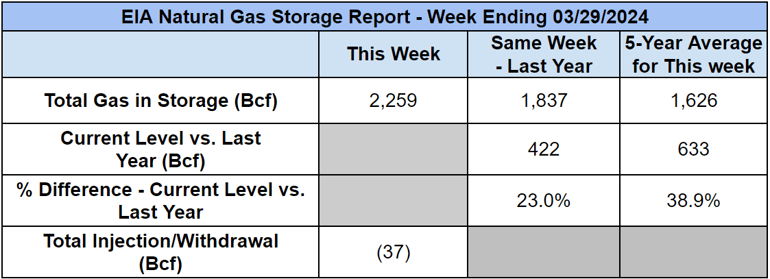
Weekly Natural Gas Inventories
The US Energy Information Administration reported last week:
- 37 Bcf decrease in US natural gas storage
- 78.4 Bcf the five-year average withdrawal for March
- 2,259 Bcf total US natural gas in storage last week
- 23.0% higher than last year
- 38.9% higher than the five-year average
US Energy Market Update
A summary of recent changes and important information about the US energy markets.
- Large swaths of North America will experience a rare astronomical event on Monday afternoon, April 8, when the moon will pass directly in front of the sun. The path of totality–the total eclipse trajectory as seen from the US–takes a line from San Antonio Texas, through Indianapolis, Buffalo, and Burlington, VT.
- Grid operators across these territories are prepared for the event though it does require some planning. In Texas for example, solar represents about 10-17% of installed capacity (seasonal range) or over 22,000 MW. This will be reduced by as much as 93% for a few minutes in the afternoon.
- Operators will need to model the approximate impacts and ready quick dispatch assets and load following generation resources to fill in the gaps. Batteries, pump storage, and some newer gas turbines are great assets for this kind of work.
- Have no fear. Operators do have some experience with sudden drops in solar production. It happens every day between 3-6pm for example, however next week’s eclipse will be a bit shorter, and more dramatic.
- A moderate end to the winter has bolstered US (and EU) natural gas stockpiles, sending short term price signals lower, to the benefit of spot buyers.
- However, the party is not expected to go on indefinitely. The leading bullish forces in the market remain twofold: (1) curtailments from US producers (down about 2.5 bc/d over the past couple months), and (2) the anticipated commercial operations of Venture Global’s Plaquemines facility in late 2024–eventually a 2.5 bcf LNG facility–see more on this below.
- Future prices have also moved up over the past month across most North American markets as traders are betting the market will rebalance later in the year.
Wholesale Power Futures Month-Over-Month
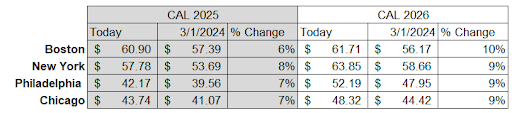
Source: CME Group
- For the time being, gas and power is cheap. Spot prices for power rose in March as compared to April in major US markets, but wholesale rates are down at least 50% YOY
- California continues to get soaked from its “atmospheric river”, which has left hydro resources brimming and adds to strong natural gas inventories in the sunshine state. Prices in Q2 should remain depressed on the West Coast.
- The 805 MW Palisades Nuclear Power Plant in Covert, Michigan will get a second life due to a $1.5B loan from the Federal Government announced last week. The pressurized water reactor began commercial operations in 1973 and was mothballed in 2022. Palisades is expected to be recommissioned by its current owner Holtec and resume operations in 2025.
US Liquefied Natural Gas Export Trends
A look at recent trends in the US liquified natural gas industry.
- Recipients of US LNG Exports - March 2024:
- Europe: 57%
- Asia: 33% (up from 25% in February)
- Latin America: 7%
Source: LSEG shipping data
- Gas supplies have rebalanced slightly from Europe to Asia simply because Europe has plenty of the fuel in the tank after another mild winter.
- LNG analysts are projecting that the US will increase its year-over-year output in 2024 on the heels of 2023 when the US became the largest global exporter of the supercooled gas (see chart below).
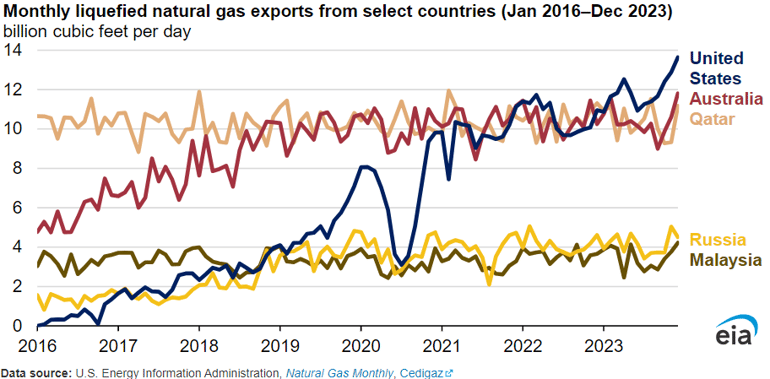
Source: U.S. Energy Information Administration
- So far in 2024, US exporters have been navigating new challenges stemming from bottlenecks that were not present in 2023.
- Passage through the Panama Canal, the fastest route for shipments to reach the Asian market, is experiencing ever-worsening drought conditions that have delayed passage through the Canal by months in some cases. Only 14 US LNG shipments have reached the Asian market through the Canal so far in 2024 compared to 40 in the same period last year. In March, there was only one cargo ship, the Diamond Gas Orchid tanker, that passed through on Feb. 28 and arrived in Japan on March 27, according to S&P Commodity Insights.
- Concurrently, Houthi attacks on vessels in the Red Sea have ceased shipments through the Suez Canal, which is the second fastest way for cargo ships to reach the Asian market. The Canal totaled close to 8% of global deliveries in 2023 however, according to a recent 2024 report by the Oxford Institute of Energy Studies, there hasn’t been a single LNG cargo ship to pass through the canal since mid-January.
- To offset these recent setbacks, a record 24 US cargoes, carrying nearly 1.6 million metric tons of US LNG, traveled to Asia via the Cape of Good Hope near the southern tip of Africa.
- In the second half of this year, US exporters are targeting completion of two new terminals: Golden Pass in Texas and Plaquemines in Louisiana. Their combined output will increase the US’s total LNG exports by 11% in 2024 alone (see chart below with 2024 as a projection on the far right side).
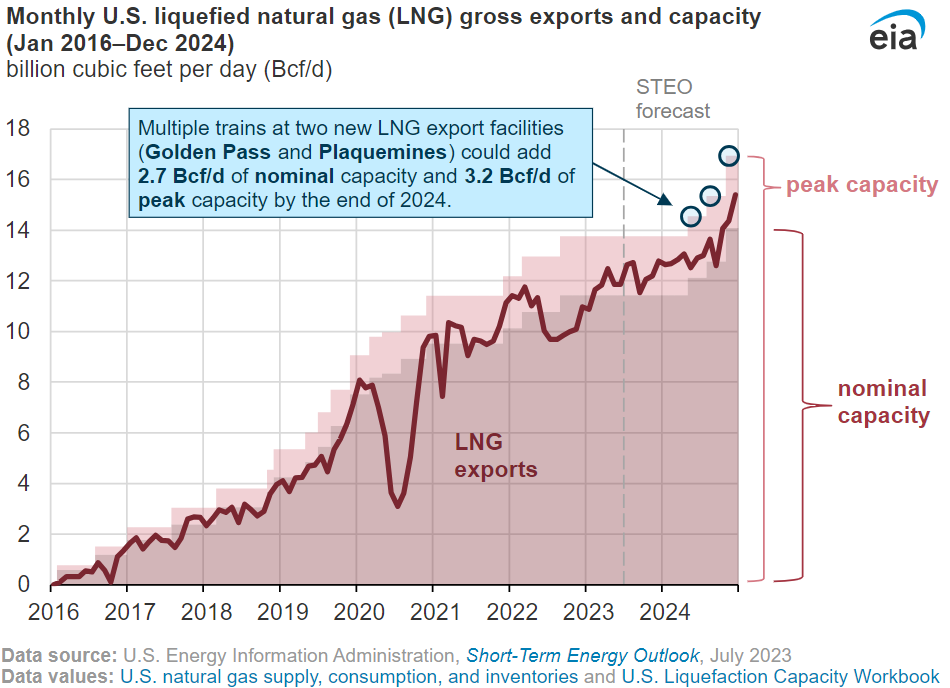
Source: U.S. Energy Information Administration
- The developers of Golden Pass and Plaquemines terminals, like the 7 other terminals already in operation, are planning to take advantage of the profitable spread between US gas and the higher prices paid at several hubs in Europe and Asia, however that was a long more compelling when the spread was $3 vs $20/MMbtu. Today the spread is closer to $3 vs $9, which doesn’t leave much margin after the $3-5/MMbtu conversion costs to liquify, ship, and cover the heavy debt burden of a multi-billion dollar terminal.
- It looks as if they too will have to plan to be flexible when choosing shipping routes if these constraints persist or new ones emerge in 2025.
Promising Electric Building Regulations Defeated
Proposed rules to create minimum requirements for electric appliances, rooftop solar, and electric vehicle charging were removed from the 2024 International Energy Conservation Code (IECC) before its final draft. They will be adopted as voluntary measures instead.
- The IECC is a design document that establishes minimum efficiency standards in new construction. It is often referenced by local building standards either directly or implicitly.
- The 2024 edition of the IECC was on track to be the first to include provisions with minimum requirements for electrical appliances, rooftop solar, and electric vehicle charging. However, on March 20, 2024, the International Code Council (ICC) directors ruled these provisions should not be a part of the base code.
- The board decided that even though these changes would likely reduce building emissions, they did not impact “the maximum level of energy efficiency” of the buildings. They did, however, include minimum commercial requirements for renewable energy in the latest IECC.
- Even though these items were removed from the base code, the directors did add them to a voluntary appendix. This will likely reduce their impact since they are not in the required portion of the IECC and cities and states would have to take extra steps to implement them.
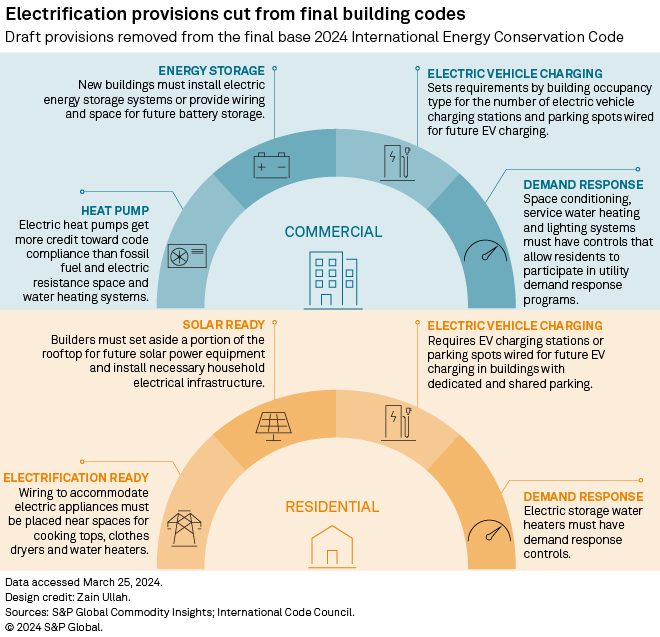 Source: S&P Global
- The IECC is updated every three years, but the newest version does not have to be adopted. In fact, many states use previous versions of the IECC as their state building code.
- The now voluntary provisions make it easier for builders to choose electric appliances and equipment over natural gas. They also reserve rooftop space for solar panels and include requirements for EV charging and batteries. They also direct builders to install controls for building users to participate in demand response programs.
- Even though this was another setback for the electrification movement, many others are happy about the removal of these provisions. Appliance manufacturers and natural gas distributors amongst others praised this decision since they claimed it would likely allow more people to adopt this version of the IECC, while preserving voluntary measures for optional adoption.
- Climate advocates were opposed to this decision saying that the ICC took in account considerations from gas distributors and others, but not the considerations of clean energy advocates. Clean energy stakeholders worked hard to create these provisions and they claim the ICC threw them out at the last minute. This is the second consecutive revision of the IECC filled with controversy. The 2021 revision had similar provisions included that were also removed late in the process.
Energy Education Series: Nodal vs Zonal Market Design
Our Energy Education Series aims to provide readers with longer form analysis of industry trends and market dynamics. A more in-depth analysis of this series is linked here. For a quick recap, please read on.
- Wholesale electricity market design generally follows two approaches: zonal and nodal energy market pricing. Zonal pricing sets a single price for a larger geographic area, while nodal pricing determines prices at individual transmission substations. This difference has significant implications for both efficiency and market behavior.
- Nodal pricing is used predominantly though the United States to set hourly prices at individual points of generation, i.e. “point of injection.” This is how producers are compensated for hourly generation. The generation rates are then averaged within geographic regions –states and utility service areas – to present zonal average rates to buyers within that territory. Nodal price derivation is more complicated but it accounts for system constraints (i.e. transmission), and provides a more granular incentive guidance for generators to match demand.
- Markets that employ zonal pricing, Europe being a prime example, calculate singular hourly prices for both generators and buyers in a region. Typically these regions follow national boundaries and they result in some notable issues:
- Inefficient price signals and dispatch–they don not account for transmission constraints across the system
- Redispatch and/or post model corrections to administratively reincorporate constraint modeling, adding uncertainty into the market
- Gaming opportunities due to bidders’ anticipation of redispatch
- Higher cost
- It is also notable that the distributed generation, and particularly intermittent renewables, will only add to the issues of zonal pricing. Intermittent generation can create real-time changes to the optimal dispatch order–an increase in wind generation from a particular region may necessitate a curtailment of a dispatchable unit in order to maximize the throughput of low cost power.
- Estimates suggest that the direct benefits of nodal pricing can range from 1-4% of operational costs.
Natural Gas Storage Data
Source: EIA
Source: EIA
Market Data
Market data disclaimer: Data provided in the "Market Data" section is for the newsletter recipient only, and should not be shared with outside parties.