Energy Markets Update
In this newsletter, we cover the factors you need to know impacting US energy markets as well as corporate renewable energy contracting, how Virginia allocates its transmission costs, NYC's incentive for reducing buildings' emissions, the LED transition, and fee cuts to cheapen wind and solar development.
Table of Contents
- Gas & Power Update
- US Tech Industry Leads Corporates in Renewable Growth
- Virginia Datacenter-Driven Transmission Costs Allocated Regionally
- NYC’s New Electrification Incentive for Local Law 97
- Light Bulb Efficiency Standards Welcome LEDs
- Biden Administration Cuts Project Fees for Wind and Solar on Public Land
Weekly Natural Gas Inventories
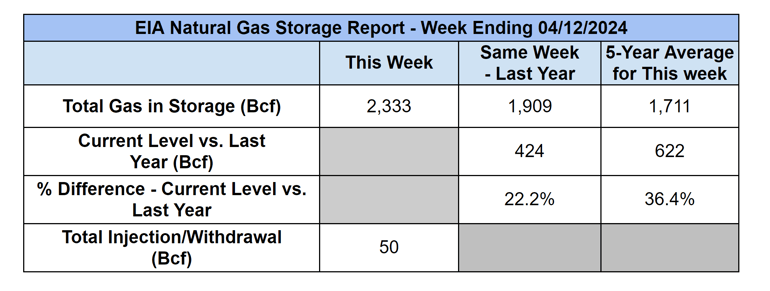
The US Energy Information Administration reported last week:
- 50 Bcf increase in US natural gas storage
- 35.8 Bcf the five-year average injection for April
- 2,333 Bcf total US natural gas in storage last week
- 22.2% higher than last year
- 36.4% higher than the five-year average
US Energy Market Update
A summary of recent changes and important information about the US energy markets.
- “So let’s not look to FERC as the big sugar daddy in Washington that is going to get all this stuff done” said Mark Christie, a FERC Commissioner during a conference in early April. The remarks throw cold water on those looking to FERC to help solve complex regional stalemates on issues of citing and cost allocation. In some ways this may be a helpful kick in the pants to states that have been doing little more than squabbling about how to meet their own sustainability goals, while also paying for it, while also ensuring basic system reliability over the next ten years. It does appear that FERC is interested in preventing states from burning the whole thing down either, so there needs to be a concerted investment in regionalization and bilateral agreement in the upper levels of state bureaucracy.
- The Great Divide. One of the most important trends in North American energy markets over the past few months is the growing divide between near term spot prices, near all-time lows, and the futures market, which is markedly bullish. This deserves a deeper dive.
Henry Hub Gas & the Great Divide
Spot Price (Yellow) vs Futures Price (Blue) - $/MMBtu
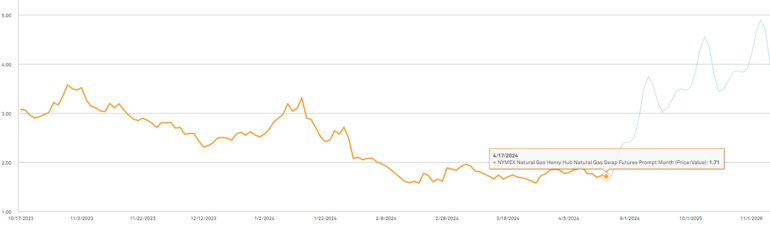
Source: CME Group
- The narrative has only been bolstered over the past couple of weeks. The traded prices for power and gas in 2026-2028 have increased by about 6% against levels that have otherwise been fairly stable since December. Energy forwards in 2025 are mostly unchanged over the same period – 2025 appears to be the new “inflection point” in the market (i.e. could go either way).
- Spot prices remain in the gutter for the time being. Much of the south and MidWest has been trading <$1.50 per MMbtu in the cash market. Strong production in the Permian (TX) even sent gas prices negative this week–just take the stuff, please!
- To summarize:
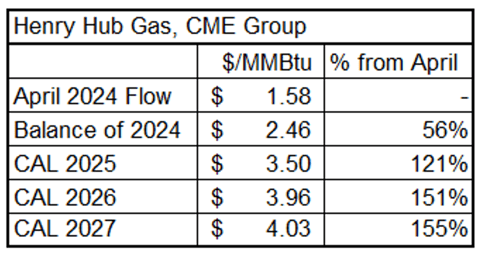
Source: CME Group
- Understanding this dynamic is an important step in forming a view of the risk premiums in the forward market, as well as the risks to buyers of waiting for better deals in the spot market.
- The reason for the weak spot market is pretty straight forward; markets are oversupplied with cheap and plentiful natural gas.
- The drivers behind the anticipated tightness in 2025 and beyond are more complicated. They rest on assumptions that production will remain somewhat flat, and that demand will increase.
- Indeed producers have started to close the spigot and daily production is down about 2-3% over the past 2 months, though it is expected to rise modestly over the next year.
- LNG export terminals are expected to account for most of the demand growth, and these bad boys are real – Venture Global LNG’s Plaquemines, LA project is expected to begin operations this summer, surpass 1 bcf/d by the end of the year, and reach full COD at 2.6 bcf/d by late 2025. That’s 2.5% of all daily production in the US. This is all on top of Golden Pass LNG and Corpus Cisti Stage III, which are expected to hit in 2025 and reach as much as 4 bcf/d by the end of the year. This is a 40% increase in export capacity that will come to fruition likely by early 2026.
- Another important component of the demand side story is the growing bullishness around the impact that AI and cloud computing will have on datacenter energy demand. This should not come as a shock to anyone, but traders are buying into the narrative now that tangible load growth is starting to show up in the numbers.
- Our view is that these significant changes to supply should be taken seriously by buyers. We are still somewhat bearish on gas through at least the next year. However 2026 and 2027 could be a reckoning and proactive buyers may wish to take some of this risk off the board, despite the premiums. The path function will be critical – how proactive will producers be in front-running feed gas demand from the big LNG terminals?
- We also see potential desolation issues emerging in 2026 related to the heavy LNG feed gas demands that will be located in close proximity to where Henry Hub gas is traded in Louisiana. JPMorgan notes that with the delay of Louisiana Energy Gateway and NG3 pipelines, which would facilitate flows to Venture Global LNG’s Plaquemines, LA facility, cash prices could be $1 higher in the trading region than in surrounding areas.
- The verdict is not out on this. Delays at these megaprojects may happen. Producers could lose their discipline and/or decide they need to keep flowing gas in order to make bond payments. The timing of tightness in the market could play out in various ways. We do expect that it will happen and while we are inclined to think that late 2026 could be a pressure point, this could slide in either direction.
US Tech Industry Leads Corporates in Renewable Growth
The contracted renewable energy space includes several trends including the tech sector's dominance, the interconnection queue, and geographic preferences.
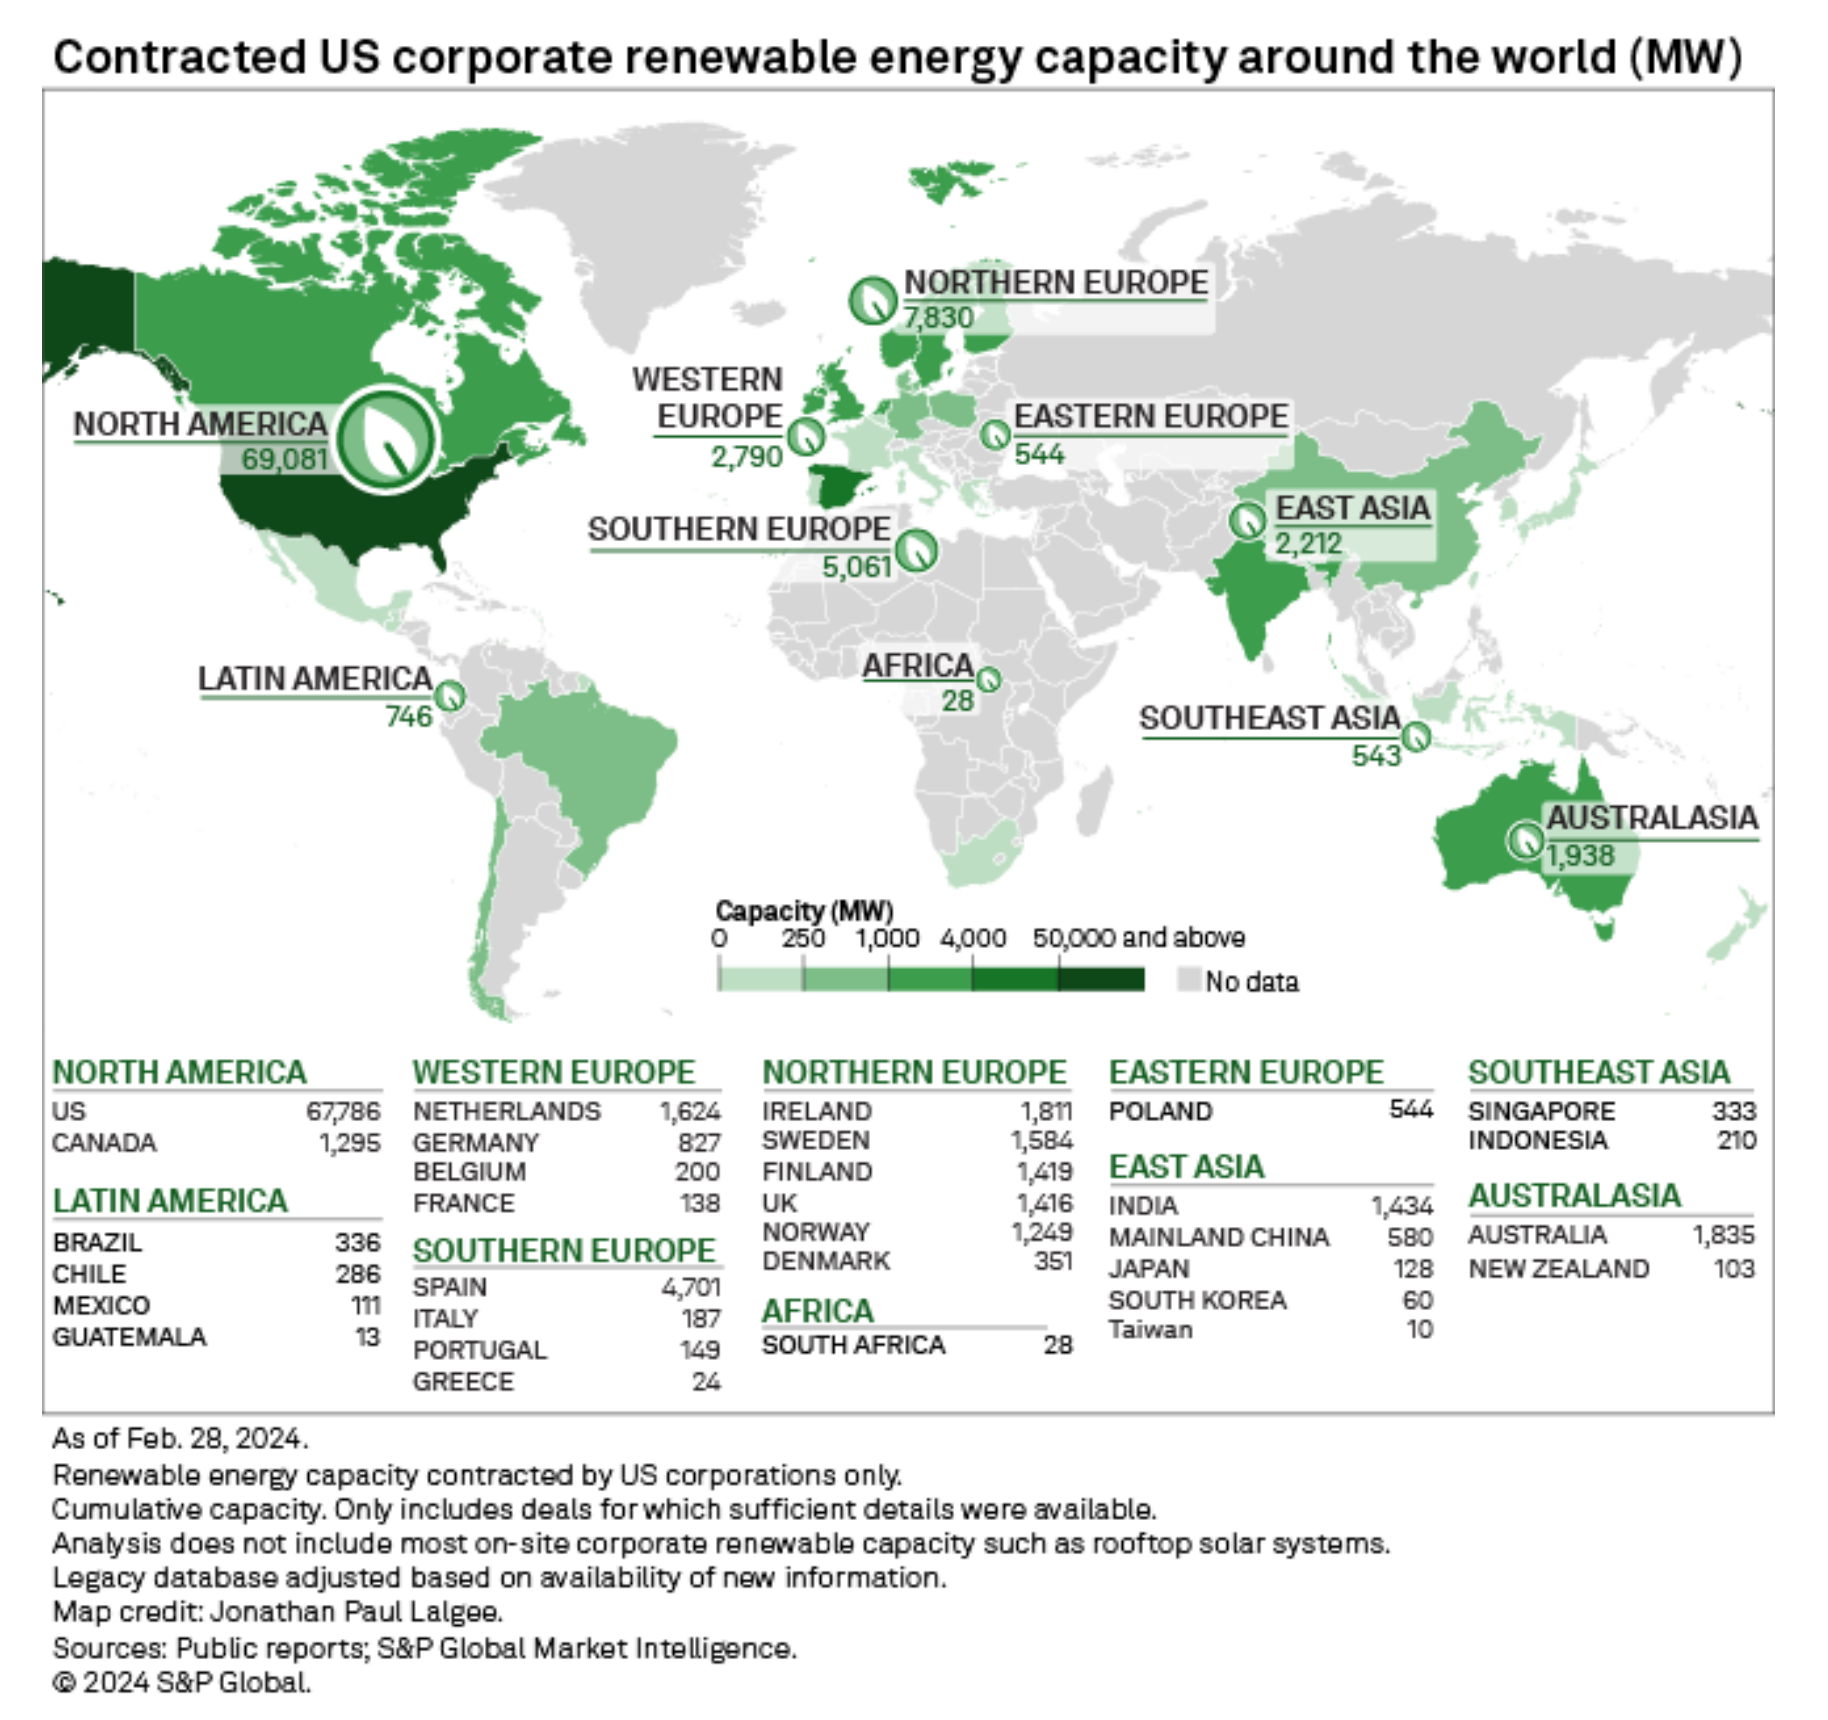
- Since March 2023, U.S. corporations have contracted for 17 GW of new carbon-free generation capacity accumulated through over 200 individual contracts. This figure pushes US corps’ aggregated contracted capacity above 93 GW – the equivalent of offsetting greenhouse gas emissions from 30 million homes annually.
- The evolving ESG strategies that US corporations, particularly those of tech corporations - which represented over two-thirds of all renewable energy capacity transactions last year - can be easier to understand for some using visualizations and charts to supplement our analysis below:
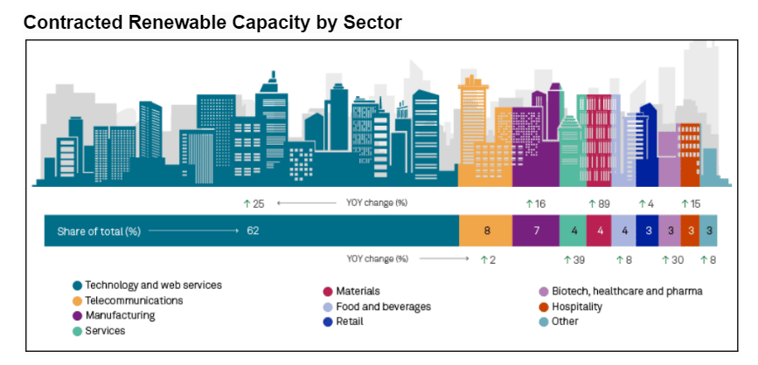
Source: S&P Commodity Global Insights
- Corporations continue to support utility-scale solar expansion most frequently, which leverages low-cost equipment, cheaper labor in the South and West, and strong federal tax incentives. The U.S. utility-scale solar industry comprised over 62% of corporate renewable capacity contracted nationwide over the past year.
- While sunny and windy Texas maintained dominance at hosting 57% of total U.S. corporate renewable capacity, 22 other states saw corporate procurement deals signed in the last year - adding up to 43 states now tracked by S&P Global Commodity Insights (see chart below). Renewables in Texas also benefit from lower labor costs and cheaper land.
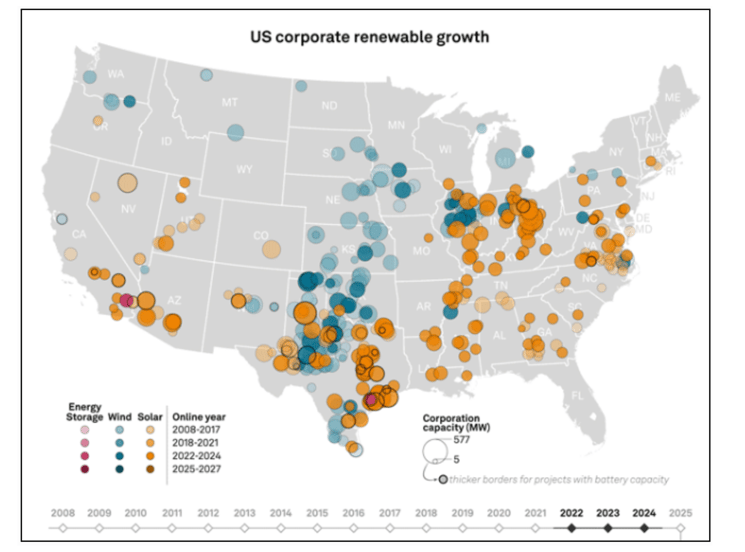
Source: S&P
- California ranked second to Texas with 1 GW of new capacity from major deals between Amazon (25% share of 67.8 GW aggregate domestic contracted capacity as of Feb 2024) and AES Corp. Utah's 525 MW Faraday Solar Project sold power to Meta via a green tariff, indicating diversification of investments across state markets. Renewables in California benefit from a strong local regulatory requirement that is targeting 60% RE by 20230.
- Though domestic procurement dominates at 75% share, more U.S. corporations are pursuing an international clean energy footprint as well. Europe, led by Spain, emerged as a prime destination with over 2.1 GW of new U.S. corporate renewable capacity additions over the past year.
- Unlike the domestic bias towards solar, international deals exhibited more technological parity, with wind and solar each holding around 50% share outside the US (See chart below).
Source: S&P Global
-
More in the Queue: looking beyond 2024, the proposed commercial operation dates (CODs) are heaviest in 2025 and 2026 (per the analysis done last year). Historically about 25% of this capacity will actually be built, but this bell curve shifts out each subsequent year as projects come online, withdraw, and new projects are added. The expectation is that almost everything added 5+ years out will be from a renewably generated source (see chart below).
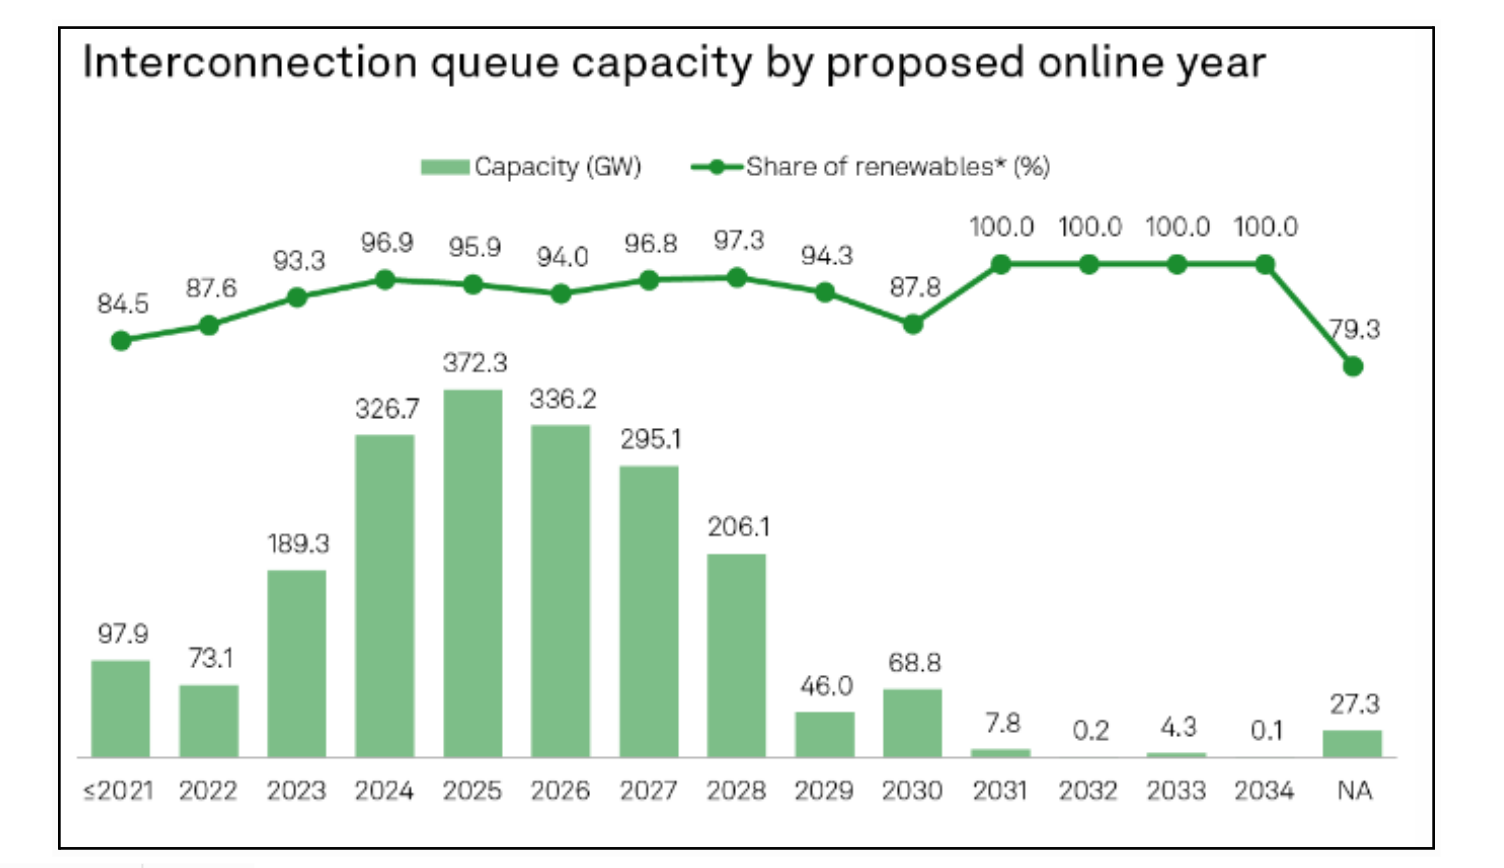
Source: S&P Global
- The majority of these projects above have not been fully contracted, yet, but this gives sustainability analysts an idea of what is in the pipeline of projects over this period. Of all the projects in the queue, 70% are between 20 MW and 210 MW.
Virginia Datacenter-Driven Transmission Costs Allocated Regionally
FERC approves PJM’s $5.1 billion plan to allocate transmission costs related to Virginia data-center growth to ratepayers in the mid-Atlantic. Virginia will roughly pay for half of the transmission costs.
- Through PJM’s 2022 Regional Transmission Expansion Plan Window 3, PJM approved several transmission projects to support data center load growth and power plant retirements primarily in Northern Virginia. PJM submitted its cost-share allocation plan to FERC, using their default cost allocation methodology.
- This methodology included allocating $2.5 billion to ratepayers in Northern Virginia, and $551 million to ratepayers in Maryland. The projects will be constructed by Dominion Energy, FirstEnergy, Exelon, PPL, NextEra Energy, Transource, and PSEG Renewable Transmission.
- Many opposers to the cost allocation plan, including the Maryland Office of People’s Counsel, argued that Virginia ratepayers should be allocated the costs for the entirety of the transmission projects because of the state's public policy incentives for data center development.
- Opponents also argued PJM should have used its “multi-driver” cost allocation formula since Virginia should roughly pay for the transmission costs that primarily benefit its datacenter industry.
- FERC rejected these arguments on April 8th, citing that Virginia would still pay for roughly half the transmission costs and that Maryland would benefit from the reliability of regional infrastructure improvements. The commission also noted that the projects did not qualify under the “multi-driver” cost allocation method because the projects aren’t subject to the state agreement approach.
- This is probably a harbinger of future tension on cost allocation issues related to buildout of the transmission system needed to accommodate growth in datacenter load. FERC also suggested, if states don’t like the cost allocation methodology, they can pursue policy measures that may impact cost allocation in other ways.
NYC’s New Electrification Incentive for Local Law 97
New York City’s Local Law 97, which seeks to regulate large NYC building emissions, was further incentivized though the Beneficial Electrification (BE) credit program.
- At the beginning of 2024 we covered the kick-off of New York City’s Local Law 97 which sets limits to the maximum quantity of greenhouse gas emissions buildings over 25,000 SQFT are allowed to produce without penalty.
- To meet these limits, building owners may opt for energy efficiency measures like switching from fossil fuel heating systems like furnaces and boilers to electric heat pump systems. To encourage and help fund this transition to clean electric heat pumps, the city created the Beneficial Electrification (BE) credit program. The biggest opportunity is for the 65 percent of LL97 covered buildings that need to reduce emissions to meet the more stringent 2030-2034 limits.
- Here's how it works: If a building owner installs efficient electric heat pumps for heating, cooling or hot water before 2030, they earn emissions credits apart from achieving a lower net carbon profile due to the installation itself. These credits reduce a building's calculated emissions under Local Law 97, making it easier to comply with the limits. Owners get double credits if they install the heat pumps before 2027 - so there's an incentive to act early. Any excess credits the building earns can be banked and used in future years when the emissions limits get stricter.
- The complete documentation on how to define, calculate and apply the BE Credit from the NYC Department of Buildings can be found here.
- Incentivizing electrification as a sustainability measure at this point in the NYC’s grid transition may come as a surprise to many when made aware of the >80% majority amount of thermal (natural gas) generation that provides power for the downstate grid. It seems likely that NYC may be putting the cart before the horse or rather the split unit HVAC systems before the offshore wind turbines. If customers swap out their gas-fired heating equipment for heat pumps and electric boilers, their electric consumption will invariably increase, potentially even double. If the GHG profile of this electricity remains high, the conversions may not accomplish as much as hoped, both for the City’s carbon goals and for customer’s wallets.
New York's Downstate Energy Resource Mix
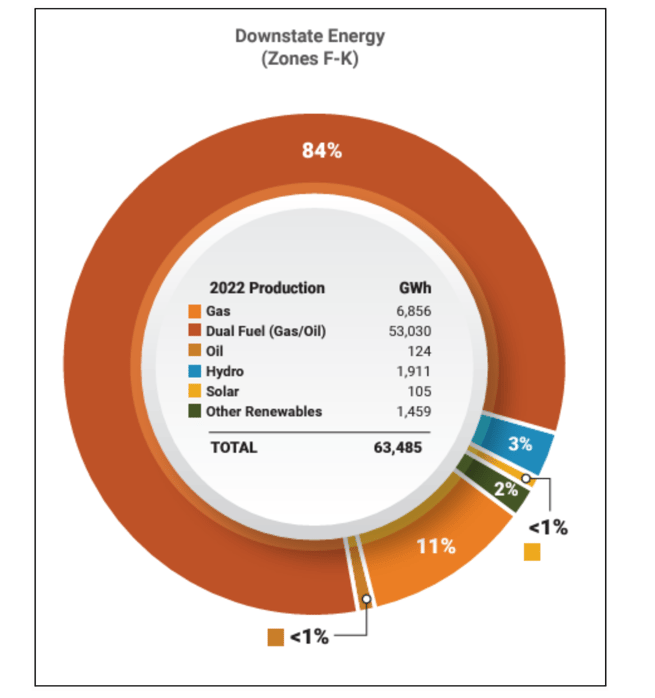
Source: NYISO, Power Trends Report 2023
Light Bulb Efficiency Standards Welcome LEDs
The US Department of Energy (DOE) issued new efficiency standards for light bulbs this week, accelerating the widespread transition to LED lighting.
- On April 12th, the US DOE issued a mandate requiring the level of most residential and commercial light bulbs to have an efficiency of 120 lumens per watt or more, starting July 25, 2028.
- LED light bulbs can easily meet this standard, however, compact fluorescent lamps typically have efficiency levels between 50-70 lumens per watt.
- The current minimum efficiency level is 45 lumen per watt. This is the second major light bulb regulation from the DOE, the first being the agency’s regulations on halogen and incandescent light bulbs in 2022.
- Most businesses and residential households have already adopted LEDs, so the impact may be somewhat muted, but lighting accounts for about 6% of residential electric consumption.
Light Bulbs Type Used in US Households
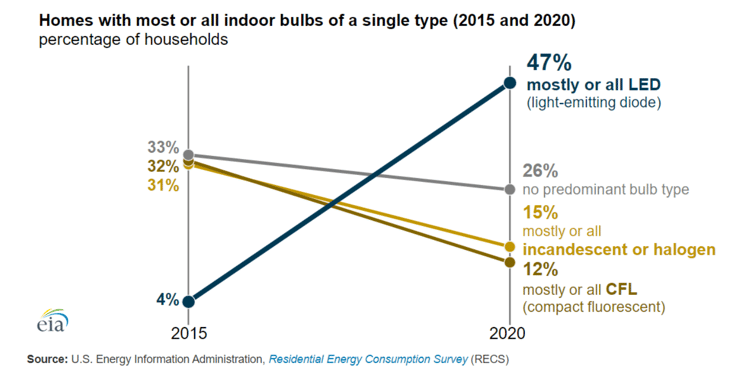
Source: EIA
- The ruling will effectively ban the manufacturing of traditional fluorescent lamps and heavily accelerate the transition to LED light bulbs. The DOE estimates that this will reduce electricity costs by $27 billion for consumers and avoid 70 million metric tons of carbon dioxide emissions.
Biden Administration Cuts Project Fees for Wind and Solar on Public Land
The Biden Administration finalized its Renewable Energy Rule, which includes capacity and acreage fee reductions for wind and solar projects on federal land. The ruling is expected to improve profitability and incentivize the creation of more renewable energy projects.
- On April 11th, the Bureau of Land Management (BLM), an agency within the US Department of Interior, issued a final Renewable Energy Rule that will reduce capacity fees by 80% for wind and solar projects located on federal land, reduce acreage fees, and streamline applications for projects in priority areas.
- For context, capacity fees and acreage are two separate fees developers pay to the BLM. Capacity fees are calculated by multiplying a MWh rate, based on regional power prices, by the volume of energy generated at the facility. Acreage fees are the effective "rent" for solar and wind facilities on granted or leased land. If the capacity fee exceeds the acreage rent, the fee would be collected in place of the acreage rent.
- The 80% reduction in capacity fees will remain in place until 2035. Afterward, the policy will transition to a 20% reduction from 2038 and onwards. Although this worsens the economics of renewable energy development past 2038, it provides clearer cash flows for renewable energy financing.
- The final Renewable Energy rule will also lower acreage rents costs. The cost will now be based on a five-year average of the Department of Agriculture's state-level pasture land rent survey values, instead of county land and building values. In priority areas, BLM will also have the ability to accept leasing applications without undergoing a traditional full auction process.
- The BLM conducted an economic analysis of the impact of the capacity and acreage reductions for a theoretical 350-MW solar facility installed on 1,951 acres of BLM land in Riverside County, California. The chart below highlights how costs decreased by upwards of 85% for many years.
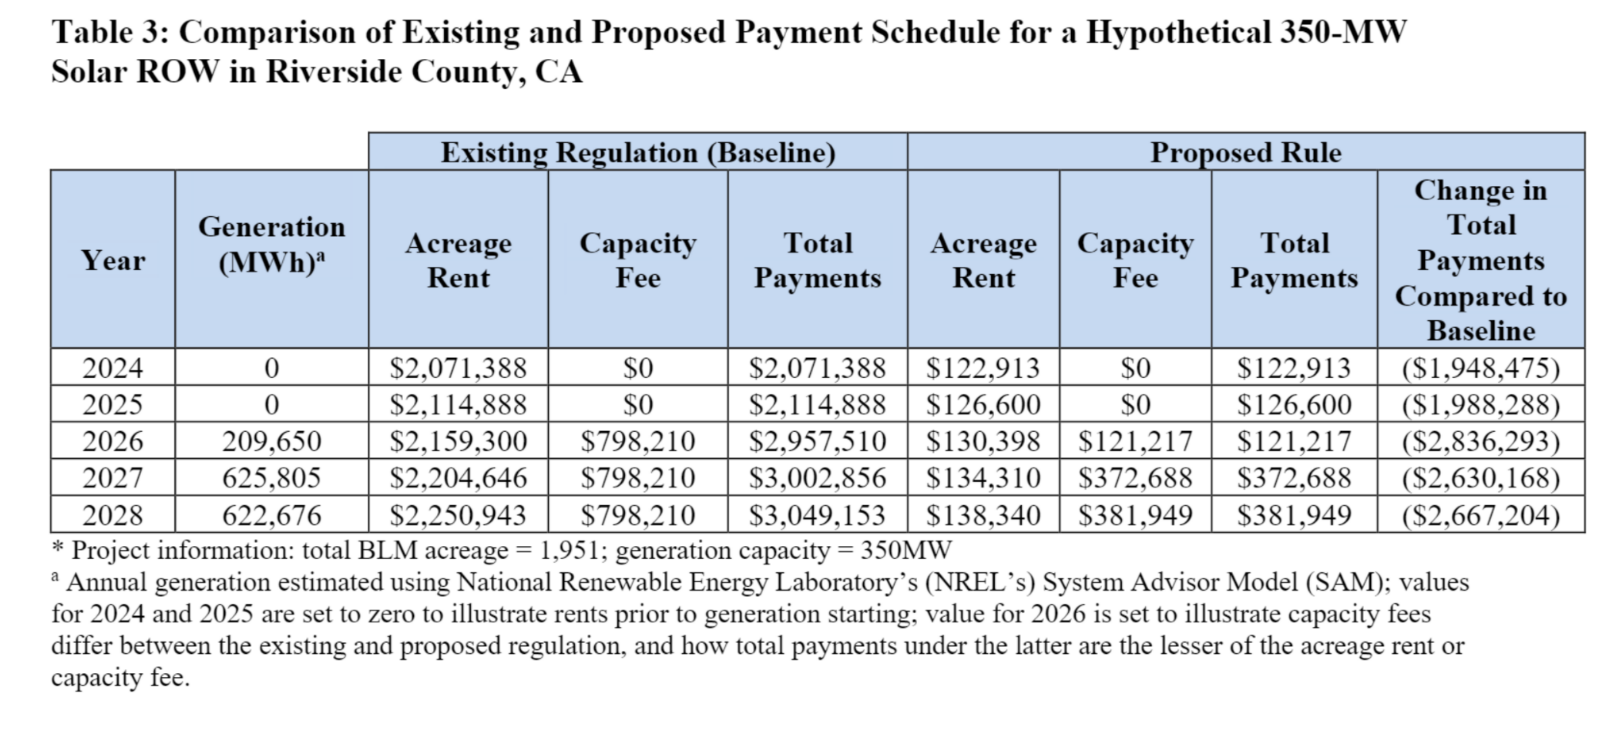
Source: Bureau of Land Management
- The above project might have an after tax CAPEX of about $350-380 MM, so the impact of the change likely reduced loan payments by 5-6% for developers.
- Ultimately, the BLM estimates reductions between $414 million and $510 million of capacity and acreage payments over a 10-year period.
- The BLM also announced it surpassed its milestone of permitting 25 GW of renewable energy capacity on public lands, with the amount currently aggregating to 29 GW. The target, which was set in December 2020, was largely successful due to the previous capacity fees and acreage rent cuts. The Biden Administration's further fee reductions emphasize the administration's full support for renewable energy development.
- The BLM also stated that two California solar projects, the Arica and Victory Pass, are operational. The projects will add 465 MW of renewable electricity to the grid and contribute to the 10 GW of clean energy capacity generated on public lands.
Natural Gas Storage Data
Source: EIA
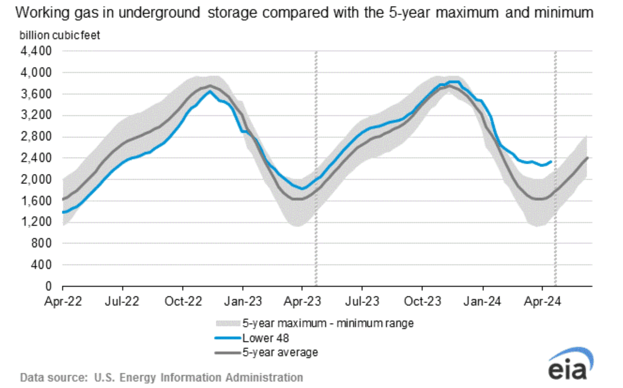
Source: EIA
Market Data
Market data disclaimer: Data provided in the "Market Data" section is for the newsletter recipient only, and should not be shared with outside parties.