Energy Markets Update
Weekly natural gas inventories
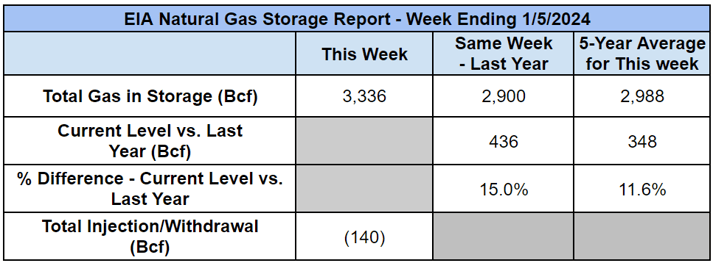
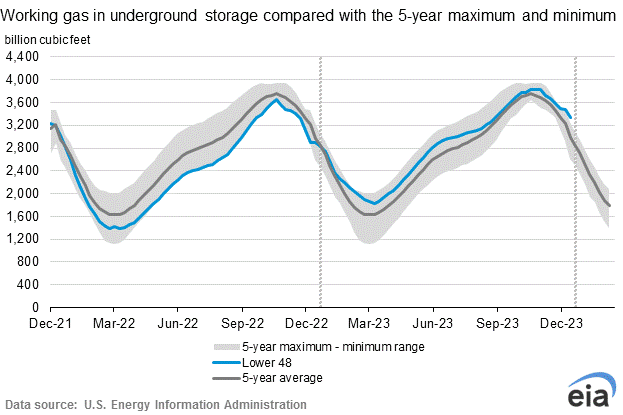
The U.S. Energy Information Administration reported last week that natural gas in storage decreased by 140 Bcf. The five-year average withdrawal for January is about 182.5 Bcf. Total U.S. natural gas in storage stood at 3,336 Bcf last week, 15.0% higher than last year and 11.6% higher than the five-year average.
Editor’s Note
In our first publication of 2024, we want to thank our readers and contributors for their continued interest, feedback, and support of our energy markets blog. We strive to provide thoughtful summary and commentary on market and regulatory news that have an impact on our clients. Some of the notable trends we are keeping a close eye on in 2024 include: (1) the impact of interest rates on energy project investment, (2) progress by various coastal states towards very ambitious renewable energy targets in 2030, (3) fundamentals of both the natural gas market and the clean energy transition, and their impacts on commodity prices. Stay tuned, and thanks for reading!
US Energy Market Update
- The end of 2023 was characterized by a precipitous decline in gas and power prices, with calendar year 2024 NYMEX gas collapsing by 25% from November through December.
- The first ten days of the New Year saw some limited recovery of near term prices–2024 is up about 10% since the start of the year–but the major shift in markets still stands: both 2024 and 2025 are now looking quite oversupplied.
- As a result, prices are likely to remain low over at least the next year, perhaps shockingly so, and the real questions are now: (1) what do suppliers do in response to low prices, and (2) how dramatic of a rebound should be expected, and when?
- With gas in storage now 13% above the 5-year average and almost +20% year-over-year, the nation is sitting on healthy gas reserves. Gas production is also strong and appears to be net long due in part to continued growth in the Permian basin, and finally, weather risks are trending bearish for gas.
- As one might expect, spot pricing has also been low thus far during the first couple months of winter. The average electric power spot price in December was $32.63/MWh in NYC and $38.14/MWh in Boston, about half off from the value traded in the futures market in November. The first 10 days of January show about a 20% increase, however they are still showing a significant discount against the forward market.
- The confirmation last week that 2023 was the warmest year on record was not a surprise to most, particularly those in the Northeast who didn’t see a single snowfall. The possibility of yet another warmer-than-average winter would create a significant surplus of gas and likely require a deep selloff in late Q1 and Q2. Buyers with index exposure might do well to prepare for this possibility.
- The most recent price forecast published by the Energy Information Administration also corroborates a prolonged price environment; the EIA decreased their 2024 forecast to $2.66/MMBtu, down 13 cents from the previous forecast, and they are forecasting <$3.00 gas in 2025 as well. The EIA forecast appears even more bearish than the market, at least for the moment.
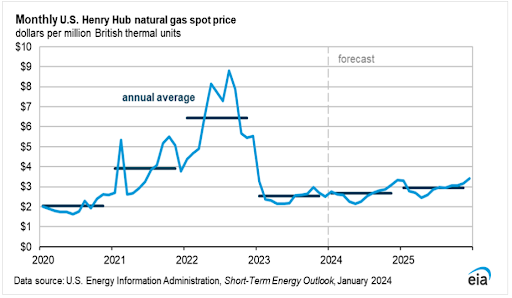
Source: EIA
- One near-term counterpoint is an atmosphering cold front aka “polar vortex” descending across the central plains over the next 1-2 weeks, and while this could cause some frigid temperatures, it is not expected to broaden or impact major load centers. In any event, the weather forecast for January has been largely responsible for the near term support of NYMEX prices as traders refocus on the physical market.
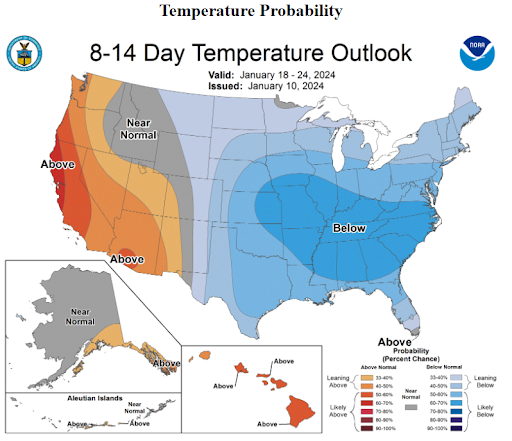
Source: NOAA
Gas Industry in MA Prepares for a Shakeup
- In December 2023, the Massachusetts Department of Public Utilities (DPU) revived an interest in its previously proposed reforms to natural gas infrastructure planning in the state. These reforms include changes to the way system planning is done and the inclusion of clean energy alternatives or “non-pipeline-alternatives” or “NPAs” as a consideration when making infrastructure investments.
- Most conversations around decarbonization focus on the electric power system or the automotive industry, for the simple reason that the decarbonization of the heating system is hard. Renewable Natural Gas is scarce–yes Veolia does produce some–and the modern day gas industry is highly efficient at moving around cheap molecules for heating purposes. Policymakers would like to accelerate the phase-in of alternatives, but the question of how these decisions are made within the existing regulatory framework is also hard work. Massachusetts could be a leader on this front.
- Recently, natural gas distribution companies in the Commonwealth gave feedback on the MA DPU’s plans by asking them to create a methodology to assess NPAs, such as electric heat, heat pumps, and geothermal heat, to make it easier to compare to fossil fuel pipeline upgrades. This methodology should help gas companies determine how these alternatives will impact the system, both physically and logistically, and how likely customers are to adopt it. This methodology could also help distributors measure these renewable alternatives against adding more liquified natural gas (LNG) infrastructure, which is currently used to help meet peak winter gas demand.
- Another topic discussed by the gas utilities was pipeline safety considerations. Safety is of concern to gas companies since they may have to make significant investments to meet new safety standards, and these investments into existing infrastructure would be in direct contrast to the new rules. Additionally, the companies wanted clarification on whether they’d have to consider alternatives on projects that are required to comply with federal regulations.
- Lastly, gas companies focused on how the MA DPU was planning to calculate emissions reductions. They currently calculate their emissions through a method based on the miles of pipeline inventory and materials in order to comply with the Massachusetts Global Warming Solutions Act. However, in 2022 the state created sub-limits for emissions that gas companies are required to account for. The new methodology referenced this law, which the gas utilities interpreted as needed to account for their customers’ Scope 3 emissions.
- In addition to requiring gas distributors to consider cleaner pipeline alternatives, the DPU also requested that distributors submit a Climate Compliance Plan starting in April 2025. These plans are similar to many companies’ sustainability plans where they discuss how they plan to reduce their Scope 1 and Scope 3 emissions.
- All said, it is much more difficult to scale back the existing gas infrastructure than to curtail its further expansion. In the near term, expect this to be the focus area in both regional decisions–i.e. interstate transmission–and increasingly in local regulation.
NYSIO’s Interconnection Queue for 2024 Leaves Natural Gas Out
- The New York ISO power generation interconnection queue lists the status of requests to interconnect new or increased capacity-generating facilities in the state.
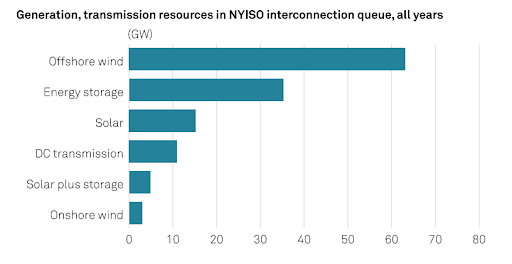
- For the first time since at least 2017, future years do not include any gas-fired resources and are instead dominated by solar power, energy storage, onshore wind power, and offshore wind power (see chart below).
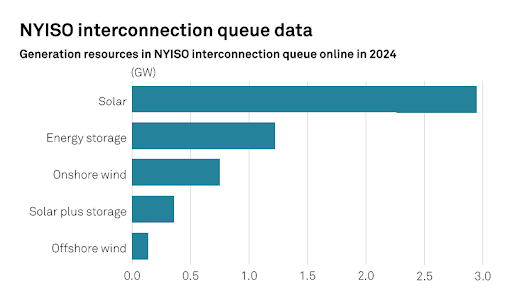 Source: NYISO
 - One milestone change for NYS’s queue is that the first offshore wind power is included by way of the anticipated completion of the South Fork Wind project. The project, developed by Orsted and Eversource Energy, is a 12-turbine project that is expected to connect to eastern Long Island later this year.
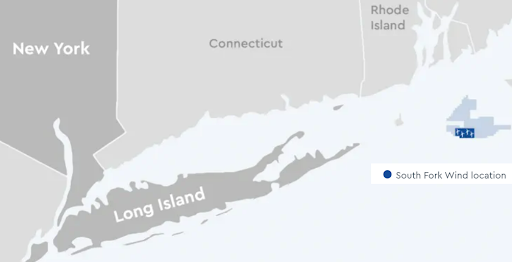
Source: southforkwind.com
- Across all future years in the queue, offshore wind power has become the dominant resource. Energy storage is the next-largest resource in the queue, followed by solar power and DC transmission (see chart below).
- For all those interpreting this as a gas-free future however, think again. Natural gas still accounts for about 50 percent of NYISO generation. Wind and solar accounted for less than 4%. Just a couple months ago NYISO recently stepped in to prevent about 560 MW of gas-fired capacity from retiring next spring, citing an in-City generation shortfall that is not likely to be relieved until at least 2026.
 Source: NYISO
- Readers should note that the data charted above represents the potential future mix of power resources, but not all projects in the queue will get built. The chart serves as a proxy for what the future power generation resource mix could look like based on requests to interconnect at the time of writing.
NYC’s Local Law 97 Took Effect on Jan 1, 2024
- On December 18th, 2023, the final version of the second major rule package for Local Law 97 (LL97) was published by the New York City Department of Buildings. The final version included details on how to demonstrate good faith efforts to reduce carbon emissions, penalties for noncompliance, and incentives for early electrification efforts.
- LL97’s emission limits for buildings over 25,000 gross square feet subsequently went into effect on January 1, 2024 and is expected to impact approximately 50,000 buildings across the five boroughs. The carbon (CO2e) limits get stricter in 2030 and beyond.
- Building owners must submit their first annual compliance reports, including total emissions for 2024, to the Department of Buildings by May 1, 2025.
- Veolia supports clients in the Big Apple to understand and mitigate their exposure to potential penalties through energy efficiency projects and metering solutions. For more on the impacts of LL97, click here.
Data Center Power Demand and Energy Efficiency Legislation
- The growth of cloud computing has changed many aspects of modern daily life, however the impacts on the energy industry are often overlooked. It is estimated that data centers consume about 130 TWh of power in the USA, roughly 2.5% of total electricity use. This number could triple by the end of the decade due to technologies such as AI.
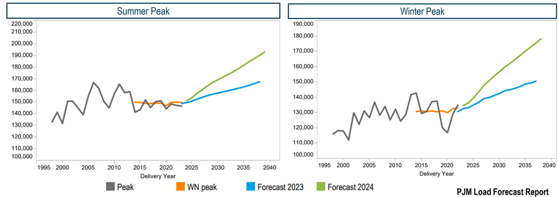
- Data centers in PJM have driven peak load forecasts to an all time high. PJM’s January 2024 load forecast projects that summer peak load will increase an average 1.7% per year over the next 10-year period, and winter peak loads are predicted to increase by an average 2% over a 10-year horizon.
- The forecasted 2024 summer forecast peak load is 151,254 MW, and the forecasted 2034 summer peak load is 178,895 MW. The 2024 peak winter load is forecasted at 134,663 MW, and 2034 load is forecasted at 164,824 MW.
- The high net energy growth rate in Dominion Energy, estimated at +7.4% annualized, is largely driven by the data center load usage in Virginia, where 35% of the world's hyperscale data centers are located, the largest in the world. Dominion Energy projects that data center load in Virginia could grow to 10 GW by 2035, significantly higher than the peak load of 2.7 GW reached in 2022.
- In response to this rising load use, the Virginia House of Delegates have proposed a new data center efficiency bill, HB 116.
Source: PJM
- The bill incentives clean energy use through sales and use tax exemption for data centers who have a power usage effectiveness score of 1.2 or less.
- If the facility is located in a building complex with other commercial uses and the facility represents more than 20% of the complex’s square footage, data centers must achieve an energy efficiency level that is equivalent to the top 15% of similar buildings constructed in the past 5 years.
- HB 116 will also require data centers to procure clean energy and associated renewable energy certificates that amount to at least 90% of their data centers’ electricity requirements by 2027.
- Tax exemptions will not be granted to centers that use diesel fuel for on-site power generation, incentivizing data centers to adopt hydrotreated vegetable oil fuel, a sustainable diesel-fuel alternative, or an alternative backup technology such as fuel cells.
- Further regulatory framework which encourages the use of waste heat, heat pumps, smart heating and cooling systems, and energy storage, could improve power usage effectiveness of data centers and reduce grid stress.
- Veolia is one of the premier data center commissioning agents in the country and is highly focused on solving the many challenges faced by the industry, including, commissioning, technical facilities management, energy plant operations & maintenance, and onsite generation. If we can help your business, give us a call and check out our website.
Natural Gas Storage Data
Source : US EIA
Source: US EIA
Market Data
Market data disclaimer: Data provided in the "Market Data" section is for the newsletter recipient only, and should not be shared with outside parties.


