Energy Markets Update
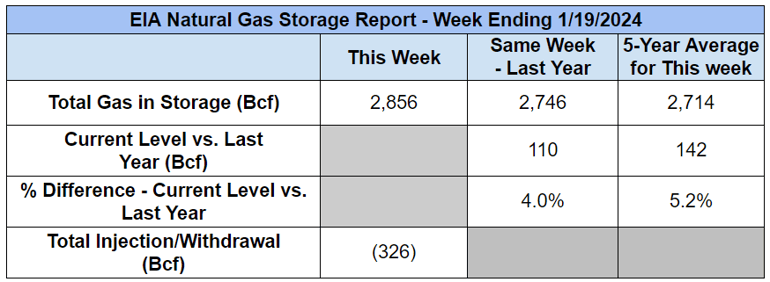
Weekly natural gas inventories
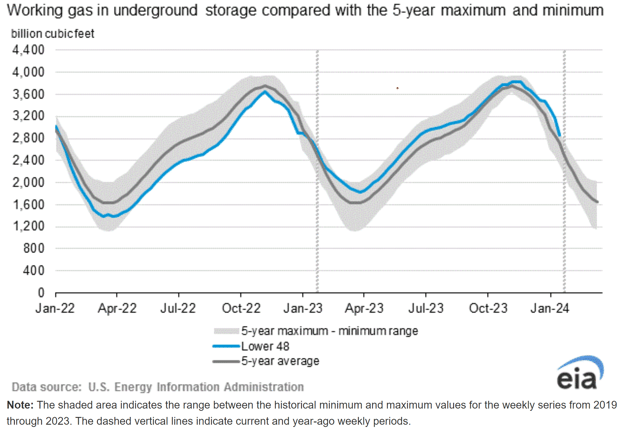
The U.S. Energy Information Administration reported last week that natural gas in storage decreased by 326 Bcf. The five-year average withdrawal for January is about 182.5 Bcf. Total U.S. natural gas in storage stood at 2,856 Bcf last week, 4.0% higher than last year and 5.2% higher than the five-year average.
US Energy Market Update
- Despite a brutally cold week for large swaths of North America, traders shrugged and maintained their bearish outlook on natural gas for 2024 and 2025. Movement in calendar year strips for 2024-2027 has been less than 1% since the start of the year.
- No doubt, the past 2 weeks have been frigid. Temps across the Northern Plains had us recalling the convergence of Celsius and Fahrenheit (-40), and this precipitated the massive drawdown in gas inventories released in today’s storage report. The 326 Bcf reduction for the week ending Jan 19 was consistent with analyst expectations. Next week’s release is expected to show a pull of another 228 Bcf. The withdrawal for the corresponding week last year was just 86 Bcf. This reflects both higher demands – 155 Bcf/d during week ending Jan 19 – and lower supply due to freeze-offs at the wellhead, which was 88 Bcf/d during the cold snap, down from 105 Bcf/d the week prior.
- On the other hand, bulk energy infrastructure across the US performed reasonably well (see “Key Takeaways” below). There was no need for involuntary load shedding, power flowed between RTO interfaces as needed, thermal plants operated without significant issues, and renewable power mostly overperformed. This was a welcome contrast to Winter storms in December 2022 that wreaked havoc on eastern grids and in Feb 2021 that killed 246 in Texas and left behind over $200B in damages.
- Power grids from ERCOT Texas to SPP (North Dakota hub) showed some market price volatility, but recovered quickly and have remained inexpensive overall thus far in January.
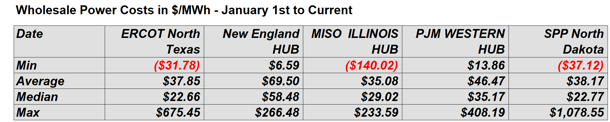
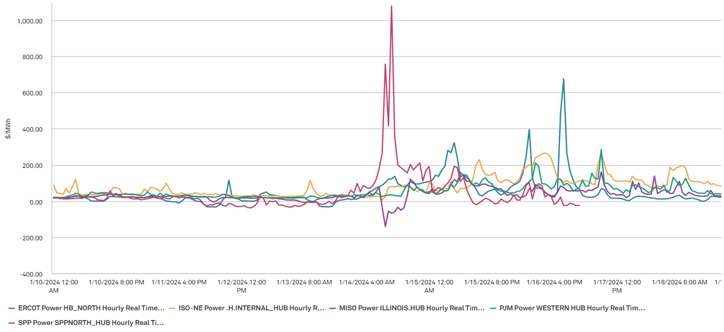
Sources: ISO Data and S&P
- As we look forward into the first couple weeks of February, forecasts appear markedly warmer. This has probably helped to keep the lid on near term prices.
- Assuming that the polar vortex will remain in the polar region, we expect most of the focus to return to timing of the completion of new LNG export terminals over the next 2 years. Total export capacity is expected to increase by 10% by the start of 2025 and another 10% by the start of 2026.
- The gas industry is buzzing this week over news that the Biden Administration may be slow-walking future approvals and subjecting them to broader environmental impact reviews. This could have massive impacts on the fate of projects anticipated by the end of the decade, including Venture Global LNG's Calcasieu Pass 2, which would be the largest facility in the US at over 20 million metric tonnes per year.
- CP2 was optimistically targeting a COD of 2026. It’s probably not a bad bet for buyers to be thinking about managing risk out in the 2026-2027 timeline regardless.
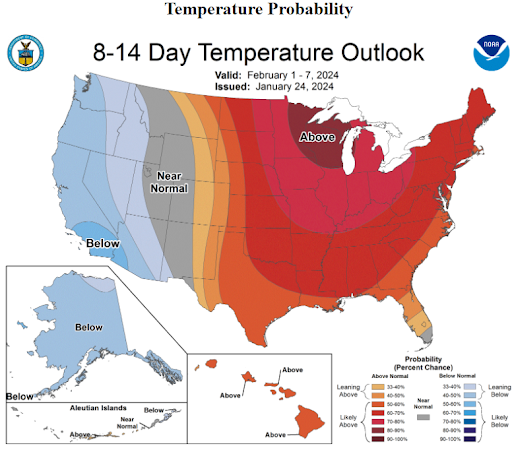
Source: NOAA
How Does Europe Get Through the Winter?
- European gas and electricity prices have been on a wild ride over the past three years, due to the war in Ukraine, the EU's dependence on Russian gas, and shortfalls in nuclear and hydroelectric production.
- In early January, Europe experienced unprecedented cold snaps (Oslo recorded a new record temperature of -30 degrees Celsius). At the same time, coal-fired power stations restarted. Great Britain is relying on its last coal-fired power station to boost its electricity supply as an arctic cold snap hits the country. Coal's share of electricity production was the highest since November.
- Nevertheless, European energy prices are down, with natural gas futures hitting a six-month low on Monday 20th as a new Atlantic storm brought unseasonable warmth and boosted wind-power generation. Benchmark gas futures dropped as much as 6.4%, falling to the lowest since July. Landed prices for LNG are now below $10/MMBtu for the first time in years. Intraday power prices in Germany and France fell below zero for several hours. They turn negative when supply outstrips demand. Indeed, there are multiple reasons that could explain why gas and power prices in Europe are steadier and lower.
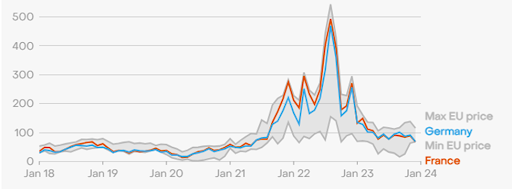
Note: Prices are average day-ahead spot prices per MWh sold per time period; Max and min prices refer to the highest and lowest average values of any country in the EU in that period - €/MWh.
Source: ENSTO-e
- In 2021/2022 winter, stocks of gas were drawn down to 25.6% of capacity. The EU responded to the low level of storage at the time by introducing mandatory filling targets, with member states required to fill sites to 80% of capacity by Nov. 1, 2022, and to 90% of capacity by Nov. 1, 2023. Ahead of the 2023/2024 cold season, gas storage capacity was almost full in all EU countries that have storage facilities (100%) compared to 2021 (77%) and 2022 (95%). EU Sees Gas Storage Levels More Than Half Full by Winter’s End thanks to gas demand cuts despite the fact that Russia’s share of gas supply has dropped by two thirds.
- European power demand in 2023 fell by 3.1% year-on-year, remaining 6.5% below the 2017-2021 average. Industrial and residential demand have seen the largest decline in consumption. In the first two quarters of 2023 gas demand met the EU target of a 15 percent reduction below historic averages (McWilliams and Zachmann, 2023a), while liquefied natural gas import capacity has been expanded by 20 percent (Sgaravatti et al, 2022) and the global LNG market remains well supplied partly thanks to the lack of significant demand growth in China.
- A major driver behind the subdued power price outlook has been the sharp rise in clean power capacity development across Europe in recent years, and widespread confidence that much further clean power development will emerge in the years ahead. Clean power sources have generated a record 59.3% of Europe's electricity through the first 10 months of 2023. Additionally, wind and solar increased by 54.2 TWh and 30.2 TWh over 2,401 TWh, respectively, compared to 2022.
- In 2022, European Union nuclear and hydro generation dropped by 118 terawatt-hours (TWh) and 71 TWh. In 2023, EU hydro generation recovered by 50.6 TWh, but still remained below 2021 levels. In aggregate, nuclear generation increased by a modest 8.9 TWh, and is more than 100 TWh below the 2021 level (697.8 TWh). Germany lost 26.1 TWh (-79.5 percent from 2022 or -90 percent from 2021) as the country’s last three nuclear power plants were decommissioned. Belgium also disconnected two nuclear plants (Doel 3 in September 2022 and Tihange 2 in January 2023) following its 2003 legislation to phase out nuclear by 2025, which resulted in a decrease of 10.4 TWh in 2023 versus 2022.[6] On the other hand, French nuclear rebounded from 2022 levels to 320 TWh as Électricité de France (EDF) successfully managed the production of plants affected by corrosion issue.
Key Takeaways from the First Cold Snap of the Year
- Beginning January 13, a significant cold snap swept across the entire continental United States. The sudden arrival of Arctic air triggered grid operators including the Energy Reliability Council of Texas (ERCOT), Midcontinent ISO (MISO), and the Southwest Power Pool (SPP) to issue cold weather and resource advisories to mitigate potential disruptions.
- Over three consecutive days (1/14 - 1/16) ERCOT set new winter peak demand records and on January 16, the peak surpassed 78,100 megawatts.
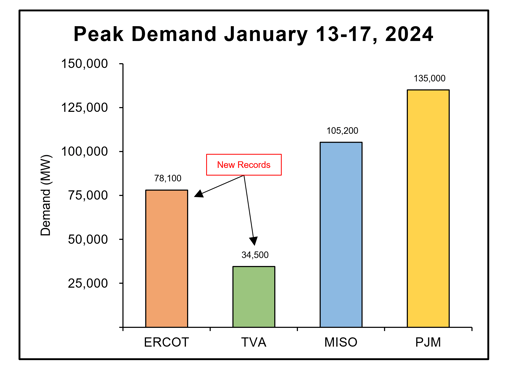 Source: ERCOT, TVA, MISO, PJM
- In contrast to the severe winter storms experienced in 2021 and 2022, the US power system demonstrated a notable level of resilience when confronted with surging electricity demand. This was due in part to measures such as interregional transmission, better coordination between the gas and power systems, conservation efforts, and enhanced weatherization implemented in response to past winter seasons.
- Notable instances of resiliency included the SPP setting a record by importing 6.8 GW of power from neighboring regions and ERCOT achieving a milestone with its record-breaking deployment of over 14,000 MW of solar generation. In ERCOT, battery storage also played a crucial role in mitigating energy price surges during peak demand periods.
- Winter storms have underscored the necessity for reliable alternatives in response to the planned retirements of dispatchable thermal power plant generation. PJM for example is anticipating roughly 40 GW of thermal generator retirements by 2030–about 20% of today’s installed capacity. Find more coverage on domestic power plant retirements below.
- Following the waning of the cold snap, FERC Chairman Willie Phillips emphasized the imperative for increased transmission capacity in the US during the agency's monthly open meeting on January 18.
- In response to these concerns, FERC has outlined its intentions to introduce refreshed transmission planning and cost allocation regulations, aimed at fortifying grid reliability. Additionally, the agency is actively exploring the establishment of minimum requirements for interregional transmission transfer capability to further enhance the resilience of the power system.
The Interplay Between Renewables and Thermal Plant Retirements
- Despite the multi-year trend of fossil fuel generation retirements, this movement slowed in 2023 throughout the US. Compared to 18.4 GW of fossil fuel capacity retired in 2022, there was only about 15 GW of fossil fuel capacity lost in 2023. This is still up significantly from the 11.3 GW retired in 2021 and was approximately 45% higher than analysts predicted at this time last year. The tapering may be due to resiliency concerns as renewable energy penetration surpasses critical thresholds; some regions are opting to retain fossil fuel resources instead of retiring them. The majority of the resources retired were coal-fired, making up about ⅔ of resources while gas fired plants made up the additional ⅓. Year-over-year, coal fired retirements decreased while gas fired retirements increased.
- The majority of fossil fuel retirements occurred in PJM, which totaled 6.7 GW and accounted for about 45% of all US retirements in 2023.
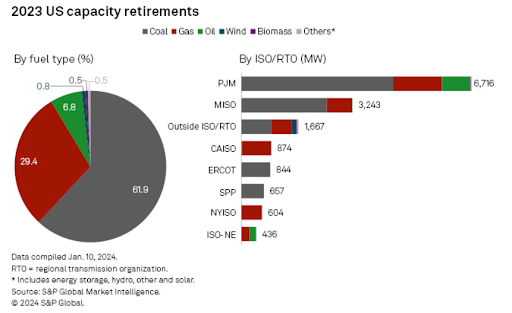 Source: S&P
- Much of the retired capacity was replaced with renewable generation, but this has led to reliability concerns, sometimes legitimate and other times not. Solar and wind output is contingent on weather and the continued prevalence of these resources, along with the retirement of dispatchable thermal plants, has left many questioning the extent to which the weather may dictate overall reliability.
- An example of this recently took place in South Dakota where the state’s public utility commission (SDPUC) asked the local utility, Xcel, to reconsider retirement plans for two coal-fired plants. These two plants make up 2.7 GW of capacity and the SDPUC is worried that planned renewable generation will not be online in time to replace them. The plants are scheduled to retire in stages in 2026, 2028, and 2030. Xcel says it plans to add about 4.6 GW of renewables in the region by 2032, but with many delays impacting renewable energy projects, the SDPUC is worried the retirement and COD timelines will not match up properly.
- Even with these long-term concerns, it’s predicted that renewable capacity will meet demand growth as we approach 2025. Solar capacity in the US is expected to more than double by 2025 to 174 GW from 2022 capacity at 72 GW. The US Energy Information Administration (EIA) is predicting 36 GW of solar will be added in 2024 and an additional 43 GW will be installed in 2025.
- The EIA also expects wind capacity to increase from 11% to 12% of total US generation capacity by 2025. Battery capacity installed is expected to increase 80% year-over-year to 14 GW in 2024 and another 9 GW is expected to be added in 2025. This means the expected national capacity in 2025 will be 40 GW, a forty fold increase from the 1 GW of capacity available in 2019.
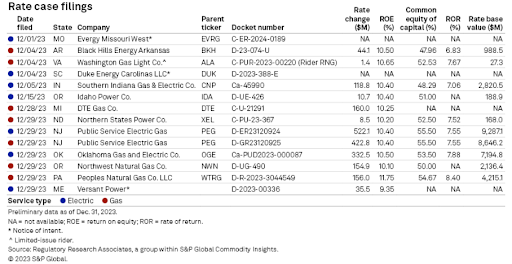
End-of-Year Rate Hikes
- The end of the year is often a busy time for state utility commissions as this is typically an administrative deadline for decisions on utility rate case requests.
- In December 2023, 14 rate cases were filed and 27 cases were decided. In total, $1.97 billion were filed amongst US energy utilities for the month, $1.02 billion by electric utilities and $0.95 billion by gas utilities. The resolved rate case totaled $3.09 billion, $2.64 billion for electric utilities, and about $443 million for gas utilities.
- These values are significantly high for a single month, however, this is a typical trend observed at the end of the calendar year, as shown in the graph below.
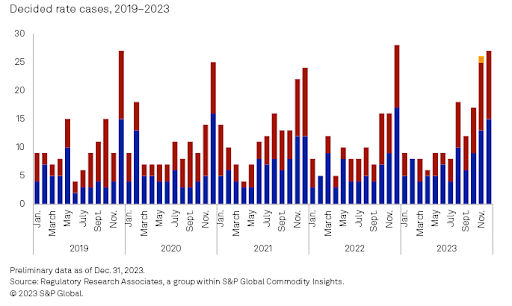 Source: S&P
- Of the approved rate cases, 19 included new returns on equity ranging (ROEs) from 8.72% to 10.75%.
- This is on par with the 9.55% average ROE authorized by electric utilities from Q1 to Q3 of 2023, slightly above the 9.54% average for 2022. The average ROE authorized for gas utilities was 9.75% for 2023 Q1 cases, up from the 9.53% average observed in 2022. Historically, this range of ROEs is relatively consistent with the stagnancy in utility ROEs authorized over the past decade.
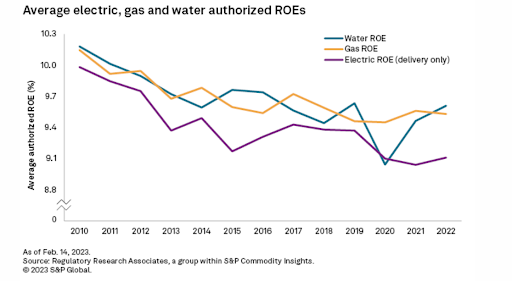
Source: S&P
- One significant decision was the Illinois Commerce Commission’s rejection of Commonwealth Edison Co.'s grid plan, citing how a different methodology must be used to “establish a rate base and revenue requirement… that is reasonable and prudent.” The commission labeled community benefits, cost-effectiveness, affordability, and transparency as numerous deficiencies part of ComEd’s proposed grid plan.
- A few other notable rate case decisions took place in Maryland. The Maryland Public Service Commission authorized Washington Gas Light Co. to increase gas distribution base rates by $10 million, as opposed to the $45.2 million the utility supported. Additionally, the commission authorized Baltimore Gas and Electric Co. to implement a three-year rate plan, with electric distribution base rate increase aggregating to $179.1 million and gas distribution base rate increase aggregating to $228.7 million.
 Source: S&P
Natural Gas Storage Data
Source : US EIA
Source: US EIA
Market Data
Market data disclaimer: Data provided in the "Market Data" section is for the newsletter recipient only, and should not be shared with outside parties.