Energy Markets Update
Weekly natural gas inventories
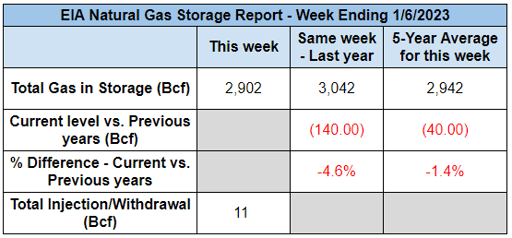
The U.S. Energy Information Administration reported last week that natural gas in storage increased by 11 Bcf. The five-year average withdrawal for January is about 164.3 Bcf. Total U.S. natural gas in storage stood at 2,902 Bcf last week, 4.6% lower than last year and 1.4% lower than the five-year average.
Kick off note from the editorial team
We’re grateful for the continued support from our clients, partners, and readers and to see that weekly readership of our newsletter continues to grow month-over-month.
This year you can expect our newsletter to have all of the same insightful content and commentary with the addition of more visual representations of the data. We aim to keep you informed of the notable events and trends that affect your organization across North American markets and Veolia’s broad range of energy services. We’re anticipating another volatile year in energy and we seek to be a trusted voice in your corner.
We ask in return this month that you confirm that everyone in your organization who should be receiving these briefs is already on our subscriber list and that you continue to always feel welcome to reach out with follow-up questions on articles we publish and provide feedback on how we can elevate our content.
US power & gas update
-
Since our last update in mid December, revised forecasts showing unseasonably warm weather for the balance of January have kicked the legs out of the natural gas market. This has presented an excellent opportunity for buyers in 2023, one that we’ve been waiting for since this past summer.
-
As of today, the 2023 forward NYMEX gas strip is down roughly 35% since the middle of December ($5.50 > $3.60 per MMbtu) and roughly 45% from the 2022 highwater mark of $6.70 per MMbtu in June 2022.
-
The last time the CAL 2023 strip traded under $4.00/MMbtu was March 16, 2022.
-
Bargain hunters in search of fixed price hedges will find the most value 2023 contracts; 2024 and 2024 prices have been more stubborn, falling only about 14% and 9% respectively month-over-month.
-
Power markets have followed suit as warmer weather has crushed the risk premiums in constrained markets. The balance of winter in New England has dropped by over 50% and potentially has further to go.
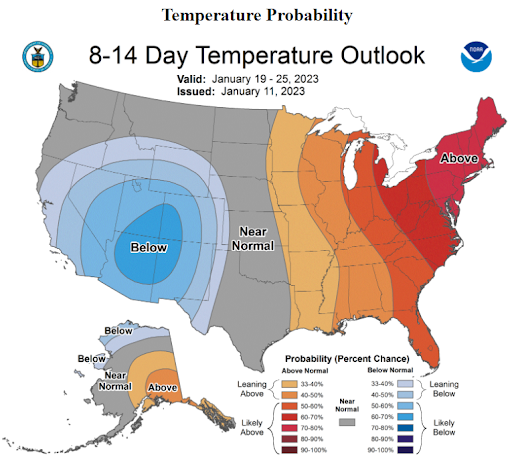 Source: NOAA
- All told, 2023 has turned notably bearish with Freeport LNG still offline (and rumored to delay restart until February), no new LNG exports expected until 2024 at the earliest, and gas production humming along. That said, regional constraints appear to be a growing pain point for both buyers (New England and California), and sellers (gas producers in the Permian).
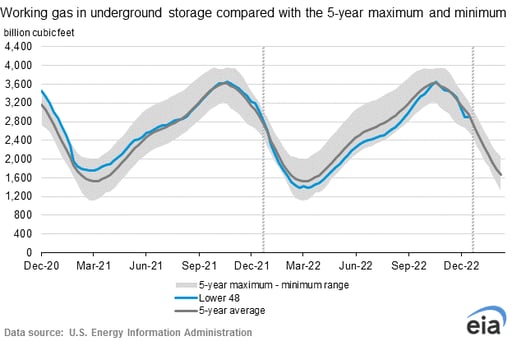
- Despite a deep freeze over the xmas weekend, today the EIA actually reported a net INJECTION of 11 bcf for the week ending Jan 6, the first in over 20 years. This put the national storage position right back in proximity to the 5-year average and climbing out of a significant deficit from earlier in the year.
- The xmas holiday wasn’t all gumdrops and candy canes for buyers though. Winter storms over the xmas weekend knocked out power for hundreds of thousands from New York to the Carolinas and westward to Texas. The Tennessee Valley Authority experienced rolling blackouts for the first time in its 90-year history. Duke Energy similarly faced blackouts, which are now being investigated by FERC and NERC.Torrential rain and wind continue to batter the West Coast, which has also been plagued by outages and reliability issues related to an “atmospheric river” phenomenon.
- NOAA estimates that weather and climate disasters caused $165B in damage in 2022.
- On a price perspective, many ratepayers will continue to experience eye popping power rates that will only add to inflation woes (see Eversource rate hike below)
- One of the standout regions over the past 2 months has been California and West markets overall, where wholesale prices have far exceeded both prior year and national benchmarks, and where they have remained sticky despite moderate weather (see below).
Coal & oil resurgence
- Coal use reached all-time high in 2022, led by emerging market growth but also strong resurgent demand in Europe as a result of the energy crisis.
- Economies on the path towards a sustainable energy transition will need to be strategic about how coal and oil are used throughout that transition. The past year reiterated a valuable lesson that there does not currently exist a readily available replacement for the reliable backup power provided by these fuels.
- Global coal consumption is expected to increase by 1.2 percent in 2022, surpassing the previous record from 2013, and forecasters expect it to remain stable between 2022 and 2025.
- A return of coal-fired generation in Germany resulted in increased emissions in Europe’s largest economy in 2022. Natural gas was curtailed due to the energy crisis triggered by Russia’s invasion of Ukraine.
- Germany’s primary energy consumption dropped 4.7% in 2022 compared to 2021. However, emissions from the energy sector increased to 255 million tonnes of CO2e compared to 247 million tonnes of CO2e the prior year. Germany has relied heavily on previously mothballed coal-fired power plants this past year.
- Renewables comprised 46% of German power consumption in 2022, up from 41% in 2021. Fresh onshore wind installations remained at 2.4 GW while solar capacity grew by 7.2 GW in 2022. However, nine out of ten auctions for wind and solar in 2022 were undersubscribed. Generation from nuclear energy dropped by 31 TWh and Germany delayed its planned nuclear exit to April 15. If rational heads prevail, Germany’s leaders will eat crow and agree to extend the lives of the remaining reactors beyond that date.
- Back in the US, oil-fired generation played a crucial role in keeping the lights on during the Dec 24, 2022 winter storm in the ISO New England
- Approximately, 2,150 MW of power generation resources in New England failed to perform as expected in the early evening hours of Dec. 24, prompting ISO-NE to declare a capacity deficiency.
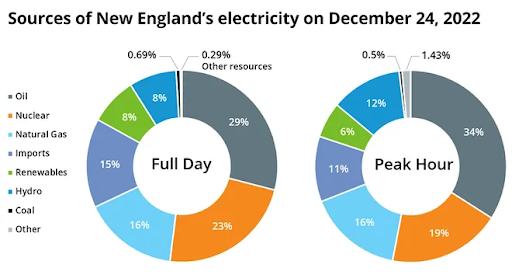
- Some gas generators generally had a difficult time sourcing physical fuel despite being the backbone of the generation fleet. Gas-fired resources typically supply the bulk of New England’s power, accounting for 53% of total electricity produced for the region in 2021 while oil-fired generators accounted for just 0.2%. During the peak hour of Dec. 24, 2022 gas-fired generators supplied just 16% of electricity produced, while oil-fired generators delivered 34%.
- Unless policy makers seriously consider the reliability implications of future grid transitions, they could end up with networks that are forced to burn higher carbon fuels under scarcity conditions.
Firm Fuel Supply Procurement Services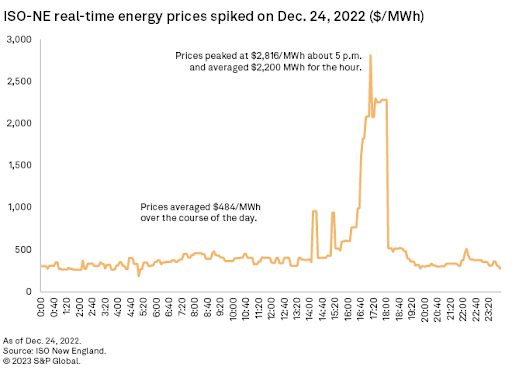
Source: ISO-NE
US RNG approaches maturity as lenders eye 50% production growth by 2024
- Renewable Natural Gas (RNG) is a biogas produced by the decomposition of organic waste material, sourced primarily from dairy farms, landfills, and municipal waste centers. After being processed, RNG is interchangeable with conventional natural gas and can thus be used in pipelines or natural gas vehicles.
- The $370 billion Inflation Reduction Act has renewed Wall Street's interest in RNG - with an investment tax credit that reimburses up to 40% of development costs for eligible biogas projects & a $0.50/gas fuel tax credit for RNG utilized as a transportation fuel.
- With the investment tax credit encouraging new projects, US RNG production capacity is expected to soar, growing an estimated ~50% by 2024 and tenfold in the long term.
- RNG is largely supported by compliance buyers in the blending, refining, and fuel import business. However voluntary buyers have increasingly been inking deals in the $20/MMbtu range. RNG has the potential for market longevity, bypassing many counterarguments tied to alternative biofuels. For instance, the 'food vs. fuel' debate around bio-feedstocks (an important consideration as climate change continues to exacerbate global food scarcity and insecurity).
- RNG is a placeholder or bridge-fuel that can address customer sustainability goals today while a more robust transition to carbon neutrality is in the works.
- Companies are approaching production differently. Some (including Kinder Morgan) are tackling smaller projects like landfill RNG, while others (like Clean Energy) are focusing on dairies. This is mainly for economic reasons, as landfill development costs range from $20 million-$50 million, while dairy farm production can cost upwards of $100 million.
PJM extends delays in announcing latest power capacity auction clearing prices
- PJM Interconnection, LLC, the grid operator across the 13-state Mid-Atlantic footprint, has once again delayed the release of its most recent electric capacity auction results.
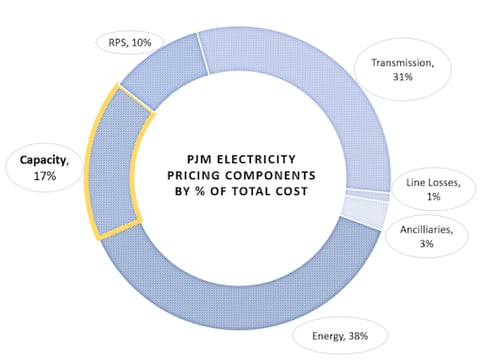
- PJM assesses capacity payments which are set using the Reliability Pricing Model and auctions to secure the appropriate amount of power supply resources needed to meet the predicted energy demand in the future.
- Capacity charges assessed for grid reliability are typically the second-largest cost component of a retail electricity agreement. See below:
- In July of 2021, PJM completed its first capacity auction in three years (i.e. after a 2 year delay), which set the price for the period May 2022 through June 2023. At that time, capacity prices settled lower than previously anticipated in most LDAs, likely driven by the market’s assessment that there was more electricity supply than demand across PJM.
- Prices for capacity after May 2023 were scheduled to be determined through subsequent capacity auctions occurring every six months until June 2023.
- In Dec 2022 however, PJM announced it would need to delay the release of the results of its latest power capacity auction for the 2024/2025 season due to a shortage in offers received compared to resources required in certain LDAs covered by the Exelon Corp. subsidiary Delmarva Power & Light Co.
- Last week, on Jan. 5, 2023, PJM notified stakeholders that it needed to continue to delay posting the indicative results of the 2024/2025 capacity auction.
- There are different strategies to consider if your organization currently needs to hedge power and capacity for facilities located in PJM for the years 2024 and beyond. One strategy is to enter into a contract that leaves room for adjustments to your facility’s capacity obligation (PLC) and another is to fix the PLC in the contract while allowing for adjustments for the outer year price of capacity. Our team is here to help you evaluate these options.
Eversource Electric Rate Hike
- Eversouce’s standard offer supply rate nearly doubled for most residential and commercial customers in Massachusetts and Connecticut when the calendar flipped to 2023
- According to Eversource, the natural gas pipelines leading into New England have plenty of capacity for the summer months but are insufficient for the winter months. This leaves New England totally reliant on liquified natural gas (LNG) during large cold snaps, such as the ones that occurred in January 2022.
- When LNG is required for heating, New England has to compete with Europe and Asia to purchase it at a much higher price than the gas that comes through the pipelines.
- Both residential and commercial customers are able to find lower supply rates by using a third-party supplier. These suppliers are often able to offer a lower rate due to blending pricing over a few years whereas Eversource only purchases energy up to a year in advance.
California’s Tenuous Energy Position
- The average price of natural gas delivered to the Pacific Coast in November and December was the highest in the nation and up 300% year-over-year
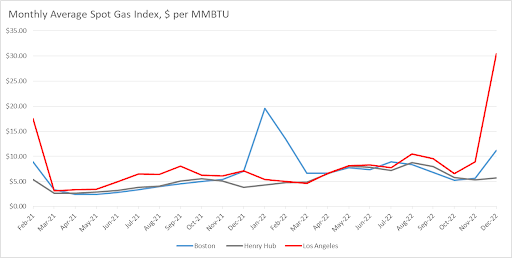
- What is most perplexing is that the price runup is only modestly linked to weather; indeed California experienced a string of $20-30/mmbtu gas days while temperatures remained in the 50s.
- This is highly irregular, even for California, although there are a number of fundamental issues impacting the California gas market. First, California is running a 35% storage deficit as compared to the 5-year average.
- The state has struggled to replenish storage since the reduction of key storage assets such as Aliso Canyon, where capacity fell from 86 bcf to approximately 68 bcf subsequent to a 2015 leak and fire. Then in 2021, CA’s largest utility PG&E reclassified approximately 51 bcf of gas in storage from working gas to “cushion gas” aka gas needed to maintain pipeline pressures and not available for use. For a region that maxes out around 250 bcf total (currently 160 bcf), this was rather eyebrow raising.
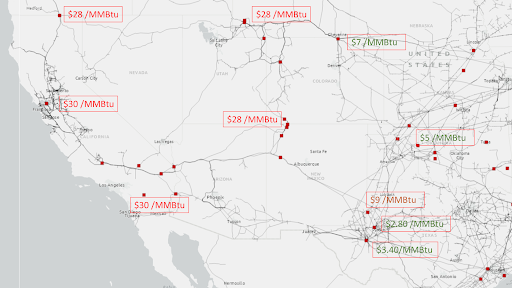
- Finally, Western markets are somewhat isolated from the rest of the country from both a production and delivery basis. There are only 3 major pipelines into California and the major production zone, the Permian, is some 1500 miles away. This means that gas must be scheduled days in advance, flows are subject to regional pathway interruptions from weather or maintenance, and it is highly susceptible to price manipulation and price gouging by the many shippers and intermediaries between.
- In fact, prices in the Texas Permian supply region were at points negative last month while California paid $30 for gas, a reflection of the bottlenecks far upstream.
Avg. Daily Wholesale Spot Gas Price in Dec 2022, S&P
- The fact is that California has been on the brink of a major energy disaster for quite some time. A major outage on a pipeline could leave 25 million people in the cold. During the summer, California’s grid at point struggles to meet demand during the late hours of the day as solar ramps down. Record heat waves this past September nearly resulted in blackout conditions even after a highly effective text message pleading for all Californians to curtail consumption where possible. Scarcity events of this type are occurring with increasing frequency and it seems to be only a matter of time before something really breaks.
- As California heads down the path of 60% renewable energy by 2030 and 90% zero carbon by 2035, this challenge is likely going to grow even larger. With growing intermittency of its power portfolio, it must be more strategic about how it uses its chemical and natural gas storage resources to balance the grid, but also to mitigate runaway prices that can upend the marginal price clearing model.
Natural Gas Storage Data
Market Data
Use the filters to sort by region
Market data disclaimer: Data provided in the "Market Data" section is for the newsletter recipient only, and should not be shared with outside parties.