Energy Markets Update
Weekly natural gas inventories
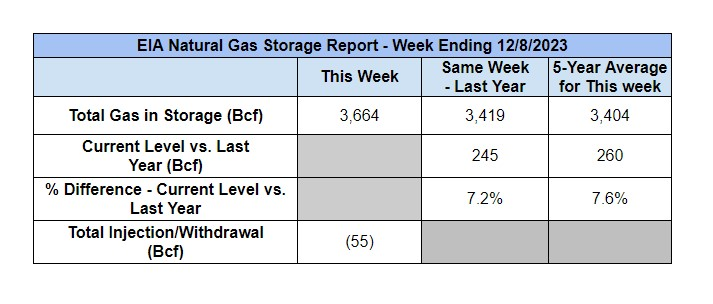
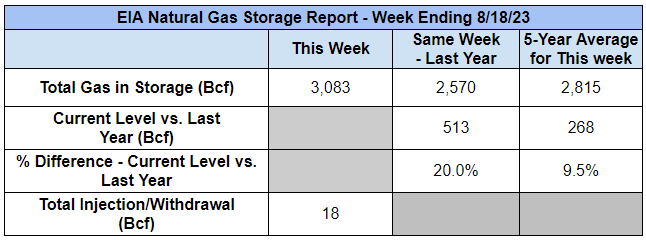
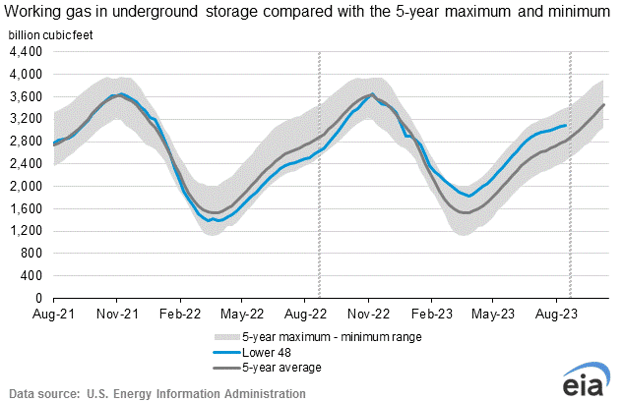
The U.S. Energy Information Administration reported last week that natural gas in storage increased by 18 Bcf. The five-year average injection for August is about 46.8 Bcf. Total U.S. natural gas in storage stood at 3,083 Bcf last week, 20.0% higher than last year and 9.8% higher than the five-year average.
US power & gas update
- In most markets outside of Texas and to some degree MISO, spot prices moderated during a mostly uneventful August. New England ISO saw the biggest price reductions and is poised to log an average wholesale price < $30/MWh in August, compared to $43 in July.
- Hourly wholesale prices topped $3,500 per MWh in ERCOT last Thursday, a record for the summer. August wholesale rates thus far have averaged $190 per MWh, up from about $55 in July. Rain from Hurricane Hillary cooled the region on Tuesday, but it was back into the steamer basket by Wednesday.
- Intense heat in the Midwest could set new demand records in the MISO operating region today. The current projection is for a peak of 128,222 MW today.
- Power and gas forwards have traded mostly sideways over the past couple of weeks. The gas market is expected to tighten over the next 6 months but production remains flat, storage remains robust, and the market is not indicating any signs of concern until at least winter 2024/2025.
- Drilling rigs declined by another 12 last week according to Baker Hughes. The total number is down by 136 this year, about 20%. Declines in the rig count are often a harbinger of supply tightness in the 10-20 month timeframe. More conservative buys should consider minimizing risk in 2025/2026.
- Renewable PPA rates are getting pricier. LevelTen Energy, in a recent analysis, found that renewable energy Power Purchase Agreements increased by nearly 30% since the pandemic.
- In European markets, industry group Gas Infrastructure Europe reports that inventories are now >90% full with months to go before the thick of the heating season. The risks in Europe are still massive, but robust inventories for now will likely contribute to some slack and price suppression in global LNG markets over Q4. Stateside, it may also weaken early winter fundamentals in gas-constrained regions such as New England. (Yes, we still have to import LNG into New England to keep the lights on occasionally….)
Source: S&P
Insuring the uninsurable: The cost of utility insurance amidst climate uncertainty
- The tragic fires in Maui last week are a staggering reminder of the vulnerabilities that utilities face with respect to extreme weather events brought about by population growth and a changing climate.
- Wildfires in Lahaina are believed to have been sparked by power lines owned by Hawaii Electric Light Company (HECO) and worsened by abnormally dry brush and winds fueled by a hurricane offshore.
- The fire decimated HECO’s uninsured transmission and distribution infrastructure, but the utility is also bracing for an extended and costly litigation ahead. You might be wondering why some utility assets are uninsured; the answer is that there is growing reluctance to provide insurance in the private market and many utilities self-insure portions of their infrastructure.
- The fire caused HECO’s parent company’s credit rating to drop to junk from Moody’s. HECO has for decades been one of the most profitable electric utilities in the country.
- This isn’t the first time a major utility has had to file for Chapter 11 bankruptcy after a wildfire. In 2019, California’s Pacific Gas and Electric (PG&E) filed for Chapter 11 after several wildfires ravaged the state, including the Camp Fire that was also started by a power line, killing 86. That fire saddled PG&E with liabilities approaching $60 billion.
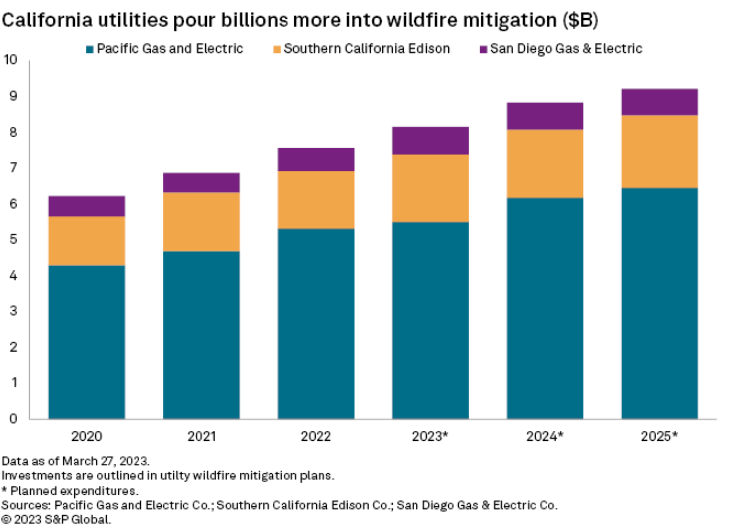
- While California’s infrastructure was insured at the time of their worst fires, the newly emerged company faces high insurance premiums after their restructuring. California utilities also spend a staggering amount on wildfire mitigation, almost $10 billion per year.
Source: S&P
- Will Hawaiian Electric face similar insurance hikes after the dust settles? What does it take for a utility to insure their infrastructure and mitigate the risks associated with fires, particularly in rural areas where they expect to more than double the mileage of conduit to enable wind and solar expansion? Are we all destined to face runaway utility costs, as they are in California, due to the growing cost of transmission, insurance, and litigation?
- The last few years have yielded some troubling trends.
- This summer, a weeks-long, unrelenting heat wave in Texas is driving system cooling demand to new records. The heat has spread to the Midwest and California, bringing about similar increases in power demand in those regions.
- Last summer, it was the Pacific Northwest to experience 100 degree plus temperatures.
- In Feb 2021, Winter Storm Uri decimated utility infrastructure in Texas and left a path of destruction including 210 dead and damages ranging from $200 - $300 billion.
- If we anticipate increasing likelihood of catastrophic weather events, utilities and lawmakers will need to think proactively about the role of insurance and utility liability altogether. In the wake of the Camp Fire, California passed the California Wildfire Fund (AB 1054), which establishes a $21 billion insurance fund that utilities can draw to cover catastrophic damages ($>1B). This is a good start. Liability caps should also be considered by state lawmakers. After all, the cost of bankruptcy can be multiples more than the liability itself, the ratepayers always end up paying for it, and passivity often invites the private sector to take undue windfalls at the expense of taxpayers.
New FERC interconnection policy set to speed up renewable commercial operation
- On July 28, FERC adopted a new policy for generation interconnections. The change could accelerate the interconnection of approximately 2,000 GW of new storage and generation capacity.
- Specifically, cluster studies are now to be evaluated on a first-ready, first served process as opposed to the previous first-come, first served process.
- The major change is the first in two decades to FERC’s interconnection policies.
- Other provisions in the policy require projects to demonstrate increased financial commitments to remain in the queue and firmer deadlines for the completion of cluster studies.
- This comes as FERC’s interconnection queue grew significantly in recent years. The average time between interconnection request to commercial operation for projects in 2022 was five years, marking an increase from three years for projects operational in 2015.
- Clearing of the queue, which is increasingly composed of renewable projects, should increase grid reliability and resilience and decrease ratepayer impacts of relating to blackouts and grid issues.
 Source: S&P
ConEdison rate case: Thank you sir, may I have another?
- Last month, the New York Public Utilities Commission approved a rate plan for ConEdison’s delivery of electric and natural gas. The plan is effective from January 1st of 2023 to December 31st of 2025.
- If this sounds familiar, it’s because Con Ed settled an earlier $500M rate case in 2020, which was rolled out over a 3 year period. This next rate case will result in 6 years of compounded increases.
- Proposed electric base rate increases:
- Justification for the rate increases is to support increases in ConEdison’s property tax burden (which makes up over 30% of the increased cost over three years) and to support spending for capital improvements and employee additions that increase overall system reliability. Such changes should bring about operational efficiencies that lower operating costs.
- The rate plan also includes a mechanism for adding surcharges related to storms, uncollectible expenses, late payments, and property taxes.
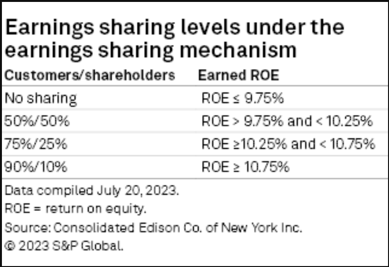
- Regulators highlight that the proposed rate increase of 9.25% is still below the national average of 9.71%. Customers may feel the effects, though, as the previously authorized return on equity was 8.80%.
- An earnings sharing mechanism is to take effect if CECONY receives more than 9.75% return on equity.
 Source: S&P
New Jersey Benchmarking Law: What to look out for
- 2023 is the first year in which New Jersey requires certain buildings to report their energy and water consumption, as per the 2018 New Jersey Clean Energy Act.
- Who has to report: Commercial buildings with at least 25,000 square feet (“commercial” defined as buildings with tax assessment codes of 4A (commercial) and 4C (residential))
Deadline to report: October 1, 2023
Report year: 2022 usage information (for the 2023 report)
- Utility usage data is sent to the US EPA and a score is generated for each building. Buildings with scores of 75 or above are eligible for the Energy Star Certification.
- This scoring system aims to give building owners insight into how to save on operating costs and increase property value, thus attracting new tenants.
- A free benchmarking service is offered to anyone in the state regardless of reporting requirements, such as commercial building owners who may still wish to track building performance using the EPA scoring system.
Natural Gas Storage Data
Market Data
Market data disclaimer: Data provided in the "Market Data" section is for the newsletter recipient only, and should not be shared with outside parties.