Energy Markets Update
Weekly natural gas inventories
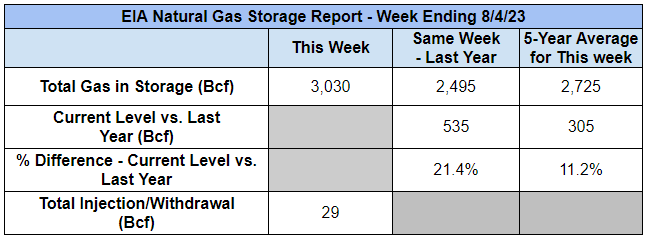
The U.S. Energy Information Administration reported last week that natural gas in storage increased by 29 Bcf. The five-year average injection for August is about 42 Bcf. Total U.S. natural gas in storage stood at 3,030 Bcf last week, 21.4% higher than last year and 11.2% higher than the five-year average.
Editor's note
- This newsletter release, we would like to take a moment to recognize the efforts of two interns on the Commodities team: Katelyn Buckley and Carlos Fraga. For the past eight months, Katelyn has worked alongside the Commodities team and been the curator of this blog. After Veolia, Katelyn will return to her fourth year at Northeastern University. For the past two months, Carlos has worked diligently on strengthening the ties between the operations of the Commodities and Business Development teams. After Veolia, Carlos will return to his fourth year at the University of Richmond. Good luck to Katelyn and Carlos!
US power & gas update
- After mostly sideways range-bound trading since May, the balance of 2023 NYMEX gas contract jumped over 10% early this week (@$3.33 per MMBtu on yesterday's close), the first meaningful move we’ve seen in months. Prompt month gas alone was up about 20% yesterday, though it has given back 5% on a "better than feared" storage report this morning.
- Despite a middle of the road storage report earlier today, the bullish move in gas markets this week is most likely a reaction to 4 straight weeks of underwhelming injection reports, reflecting record high gas consumption from the power sector and stagnant, if not softening, production.
- Total gas in storage is still robust by historical standards – 12.2% over the 5-year average – but the trendline noticeably shifted in July and hints at a reversion to the 5-year average by the end of the injection season.
- Nonetheless, 2024 and beyond have maintained significant price premiums to spot, so we don’t see any reason for changes in guidance to those tenors. Hold on to your hats over the next few months though. This could be the start of some Q3/Q4 volatility.
- As many of our readers know, in 2022 the US became the global leader in LNG exports, surpassing both Qatar and Australia, and doing so at breakneck speed.
- The US LNG industry has been consistently exporting about 12.6 Bcf per day of natural gas, about 12% of total US daily production. With another 10 Bcf/d under construction, this export volume is expected to surpass 20 Bcf/d sometime in 2026.
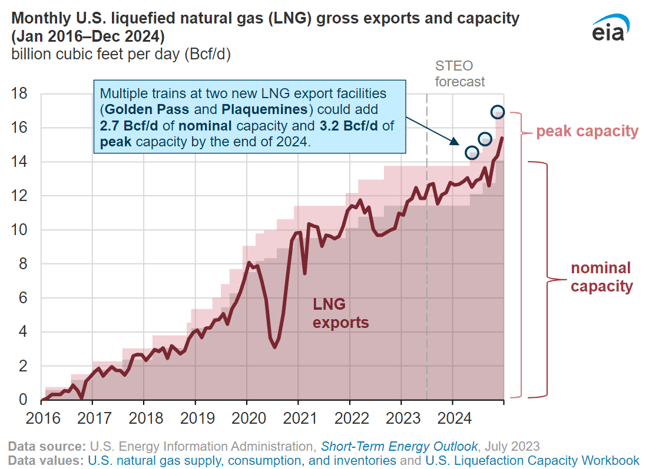
- This will be a major inflection point in future domestic markets, likely resulting in more volatility and generally higher prices here. Growing gas exports will also create a tense political dynamic given the dichotomy of exports and growing opposition to gas infrastructure and gas use in many major US cities–note Boston’s decision last week to ban gas-fired thermal equipment in new and retrofitted City buildings.
- Vogtle’s unit 3 reactor near Waynesboro, Georgia started commercial operation on July 31, the first nuclear reactor to begin commercial operation in the US since the Tennessee Valley Authority’s Watts Bar Unit 2 came into service in 2016. Unit 4 could commence commercial operation as early as Q4 of this year. Who will be the next major utility to sign up for a new reactor?
- It’s been getting (and staying) hot in here. This week most of the country has seen above-average temperatures as the blistering heatwave in Texas drones on. Hot weather is forecasted to persist everywhere but the Northwest.
Source: NOAA
Inflation Reduction Act: one year later
- It has been nearly a year since the Biden administration signed the historic Inflation Reduction Act on August 16, 2022. What has the past year looked like with this new legislation in place?
- The law provides historic provisions for the energy sector, with significant tax credits supporting investments in clean energy generation, grid infrastructure, American-made material sourcing, and union labor.
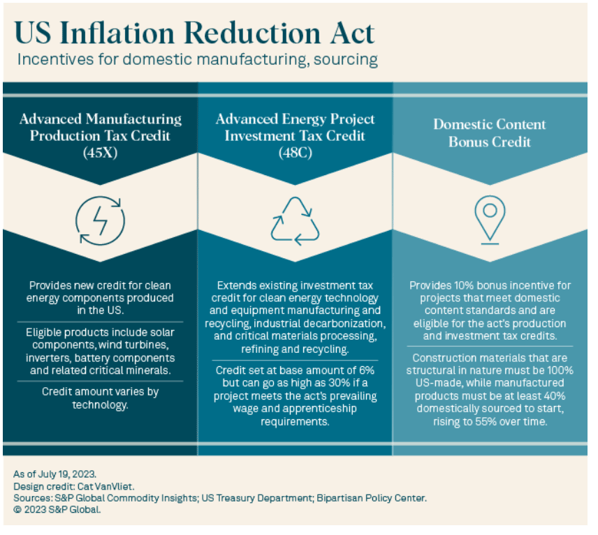
Source: S&P
- Most of the major provisions in the act became effective January 2023 so data is thin, but various sources report meaningful benefits, all to be taken with a grain of salt.
- The Center for American Progress, admittedly not an unbiased source, for example, touts the creation of 170,606 jobs, and the announcement of 272 new clean energy projects thus far.
- According to the American Clean Power Association, 83 clean energy generation projects have taken advantage of this legislation.
- And the expectations of the Act are enormous. According to a 2022 report by Resources for the Future, the cost of retail electricity is expected to fall between 5.2 and 6.7 percent over the next ten years. This translates to between $170 and $220 in yearly savings for the average American household.
- Electric ratepayers are expected to be increasingly shielded from the volatility of natural gas prices given the legislation’s push to electrify the grid from clean generating sources.
- The past year has not been without its challenges the IRA. In June of this year, the House Committee on Ways and Means approved a bill that would repeal the production and investment tax credits set forth in the IRA, alleging that the Democratic-controlled congress acts in favor of special, “green” interests.
- This was not the first attempt to gut the IRA, either. Republicans sought to rescind IRA credits in April legislation written to avoid government default.
- Despite efforts to repeal the act, the future of the IRA looks promising as industry experts and companies praise its financial support of the growing clean energy sector. If companies’ fervent efforts to block attempts to gut the act are any indication of the act’s favorability, the IRA is hopefully here to stay.
Offshore wind updates
Development of offshore wind along the East Coast has been wildly busy in recent years with construction commencement off of the coast of Massachusetts (see e.g., Vineyard Wind I), a handful of active RFPs, and some projects being cancelled. We will begin tracking these more regularly as they have profound impacts on energy prices, REC prices, and reliability.
PJM
- Last Friday, the state of New Jersey closed its 3rd offshore wind solicitation seeking to award up to 4 GW of capacity. The New Jersey Board of Public Utilities (NJBPU) is now reviewing four potential projects.
- NJ has already approved 3.75 GW of capacity and it has a target of 11 GW by 2040.
- In addition to the 3 offshore wind projects already approved by New Jersey regulators and covered in our earlier newsletters, there are now four more proposals received on last Friday 08/04, for NJBPU to review.
- One notable trend is that a couple of the larger proposals would be sited about 2x further offshore than the first iteration of projects.
- A partnership led by Invenergy LLC and co-developer energyRe LLC, submitted a proposal to build up to 2,400 MW of capacity 40 miles off the state's southern coastline, about twice as far as other projects.
- German utility company RWE AG and National Grid PLC proposed a 1,300-MW wind about 37 miles offshore.
NYISO & ISO-NE
- We reported a couple weeks ago that RI Energy, a subsidiary of PSEG, rejected a 1 GW proposal submitted by a partnership of Orsted and Eversource, on the grounds of higher than expected price. This was the sole bid received in RI’s OSW solicitation.
- BP and Equinor are in the process of renegotiating PPAs for their joint offshore wind projects off the coasts of New York and Massachusetts.
- BP’s CEO said the partners do not plan on developing the projects off the East Coast until they meet return thresholds of 6% to 8%.
- The escalating cost of equipment and construction – to the tune of 40% over the last few quarters – coupled with rising interest rates and inflation are causing BP and Equinor to get cold feet. Some energy companies like Avangrid and Vattenfall have pulled out of their wind PPA projects completely over these concerns.
- BP is adamant they will not continue development of the project if return thresholds are not met. We will continue to monitor these negotiations closely and update when new information is released.
It's rate case season! Exelon rate cases would green-light massive capex
- With six major electricity base rate cases expected to be completed in the next year, Exelon Corp. will be ready to spend $31.3 billion through 2026 on projects needed to provide access for more clean energy sources and maintain reliability, company executives said Aug. 2.
- The state regulatory proceedings for Exelon's five transmission and distribution companies serving Illinois and the mid-Atlantic region are expected to grow the utility's rate base by about 8% per year between 2023 and 2026.
- The utility's most recent rate proposal, filed May 16 by subsidiary Potomac Electric Power Co. in Maryland, includes more than $150 million for building electrification, electric vehicle chargers and distributed energy projects needed to help the state meet its 2045 net-zero emissions goal.
- Half of the investment, dubbed "Climate Ready Pathway MD," would be earmarked for an incentive program to help ratepayers switch to electric heat pumps. Exelon’s subsidiary PEPCO is requesting a $213.6 million revenue increase for April 2024 through December 2027 to cover the cost and earn a return.
- The average monthly increase for a typical Maryland residential customer would be $5.85.
- This August is a big month for rate cases, with 15 pending decisions totaling over $1 billion in increases.
- Deregulated states with pending rate cases include Connecticut, Montana, Ohio, Texas, and Virginia.
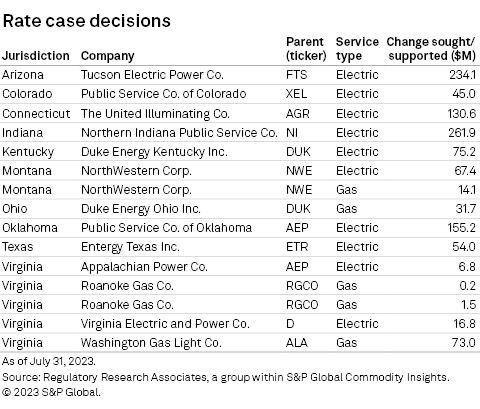
- What does this mean for our customers? Depending on the outcomes of the cases, customers may experience hikes in their electricity and/or gas rates. Stay tuned for future releases of this blog, where we will update customers on relevant rate information.
NY capacity costs on the rise
- New York State regulations are contributing to a dramatic increase in capacity prices, the second largest component of electricity supply price which make up as much as 25% of total power costs for many New Yorker’s this summer.
- In 2019 NY implemented the Peaker Rule, limiting fossil fueled generating assets from operating, with the threat of forced retirement should they not comply.
- The Peaker Rule has already caused nearly 40 power plants to retire, according to New York’s Department of Environmental Conservation (DEC). This is creating notable increases in capacity prices in Zone J (NYC) as existing plants can fetch higher premiums.
- The capacity component is the second largest a customer pays for their electricity supply. See the yellow component as a general example cost breakdown for NYC Zone J electricity below.
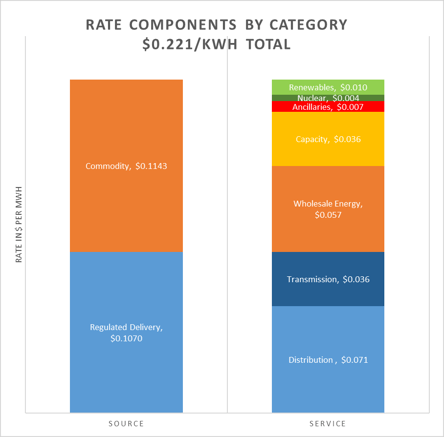
- In New York City specifically, 12 plants retired in 2023, totaling 536.5 MW. Another 25 generating units at various plants are expected to retire by the end of 2025. These plant retirements represent about 6% of local generation removed from the grid.
- As a result, capacity prices have already begun increasing and are anticipated to remain high until the injection of new clean energy projects such Champlain Hudson Power Express (est. 2026).
- See the near term spot market capacity auction price below as a proxy to where generators and purchasers of capacity are pricing future demand.
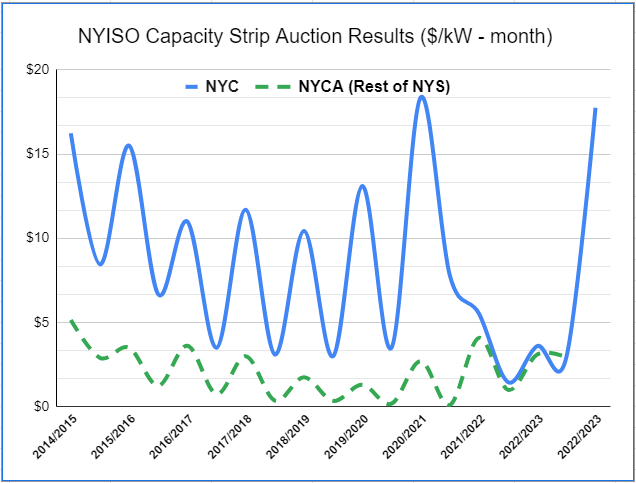
- This is not the only driver of this summer’s sky-high capacity rates; capacity prices are generally higher when rates in the energy market are lower – which they have been this summer–because generators require minimum revenue thresholds. However it does seem likely that the peak rule will entrench additional costs in the summer capacity market going forward.
Natural Gas Storage Data
Market Data
Market data disclaimer: Data provided in the "Market Data" section is for the newsletter recipient only, and should not be shared with outside parties.