
Energy Markets Update
Editors Note:
July has been a whirlwind month for the energy sector, defined by shifting federal and state policies and re-escalating global conflicts. Before we head into our summer writing hiatus, we’re wrapping up the season with a deep dive into the industry's most pressing challenges.
In this issue, we explore how different ISOs are maintaining grid resilience through severe heat waves and droughts, evaluating long-term gas purchasing strategies, and share key changes proposed to SBTI’s methodologies. At the very bottom, you'll find a summary of the critical market fundamentals we’ll be watching closely until we return in September with a fresh reality check on what has changed.
We also want to extend a huge thank you to our departing Co-op, Olivia Parsons, for her contributions over the past two quarters. Have a wonderful second half of the summer everyone!
Table of Contents
- Energy Market Update
- Natural Gas Futures: Playing the Long Game
- Summer Peak Update: July's Heat Dome & Capacity Costs
- Changes on the Horizon For Major Carbon Accounting Standards
- Introducing the Veolia Energy Markets Risk Matrix For August
Weekly Natural Gas Inventories
Source: EIA, Veolia
Energy Market Update
- Gas futures remain under pressure as a familiar trio - ample storage levels, Freeport LNG plant maintenance, and resilient domestic production – all kept the market well supplied. NYMEX prompt-month futures have traded below the $3.00/MMBtu mark since July 10, closing Wednesday at $2.925/MMBtu - down 6% from July’s settlement of $3.10/MMBtu.
- The forward curves also lost some steam. The BOY 2026, CY 2027 and CY 2028 strips softened by ~1%–8% over the past month, with BOY 2026 taking the biggest drop while the outer years beyond 2028 remained relatively flat, with a slight uptick of ~1%-2%.
- With CY 2027 and BOY 2026 trading at a ~8%–14% discount to the 2028 and 2029 strips, the market presents a potential buying signal for budget-driven consumers.
- A word of caution - the recent price dip may be a pause, not a new normal. As Freeport LNG returns from maintenance in late August, market focus will shift back to LNG exports, weather, and storage balances, potentially ending the current period of market calm.
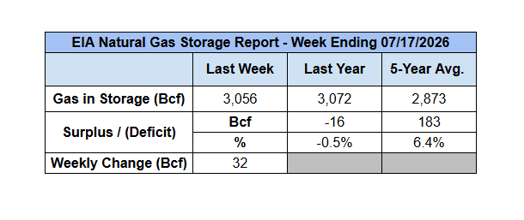
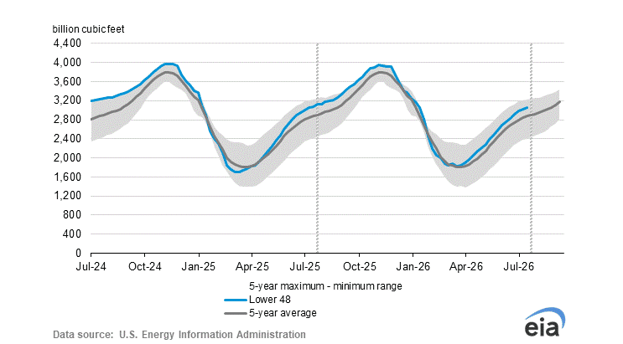
- Bearish supply fundamentals continue to weigh the gas market. EIA reported a 32 Bcf injection for the week ending July 17, beating analyst expectations and pushing inventories to 3.07 Tcf, 6.4% above the five-year average. This exceeded last year’s 23 Bcf injection and the five-year average of 30 Bcf.
- Dry gas production in July has averaged ~110 Bcf/d vs. ~108 Bcf/d in July of last year. Meanwhile, the number of active US natural-gas drilling rigs held steady at 126 since the beginning of July, below the 2.5-year high of 134 rigs in February 2026. The slower rig activity suggests producers remain disciplined despite elevated production levels.
- On the demand side, feedgas deliveries took a massive hit when Texas's Freeport LNG terminal began major maintenance on July 10th. Given Freeport’s typical demand of roughly 2% of U.S. daily gas supply, the outage could push additional gas into the domestic market. Even so, average LNG feedgas flow in July remains strong at ~17.3 Bcf/d, though still below the record 18.8 Bcf/d reached in April.
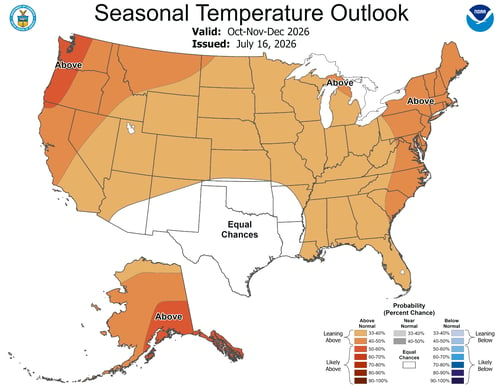
- Looking beyond the summer sizzle, a powerful El Niño could become the next major market driver. Warmer-than-normal winter conditions across the Northern Hemisphere could reduce heating demand and create a bearish backdrop for natural gas prices. We will continue monitoring El Niño's evolution and its potential market impacts as the winter season approaches.
Source: NOAA
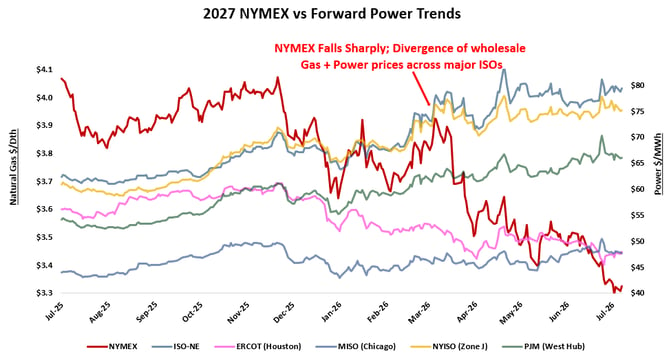
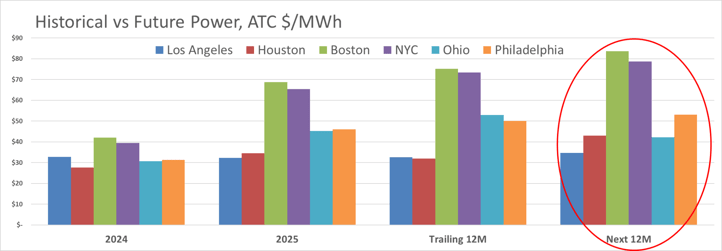
- July's first heatwave turned up the heat on power markets. Higher cooling demand tightened grids and lifted wholesale power prices across multiple ISOs. Readers can read a detailed article on summer peak below. Meanwhile, natural gas prices continue to soften but power prices have gone up or remained muted over the past month, reinforcing this month's "A Tale of Two Citygates" theme, as shown in the chart below.
 Source: Veolia, Argus
 - Markets for a year of forward power in Boston (+11%) and Houston (+35%) are presenting the highest premiums as compared to the trailing 12 month settlements. New York, Boston, and Philadelphia are showing the most significant moves since 2024 actuals with gains of 70-100%.
Sources: Veolia, ISOs, Argus - Renewed conflict between the US and Iran has once again closed the Strait of Hormuz, sending oil prices up 20%+ and dampening optimism for a conclusive end to the war. Winter power futures in New England have been fluctuating on this news. New England is the one region in the US with some reliance on spot LNG cargoes tied to global market indices.
- On July 14, PJM Interconnection announced the results of its 2028/2029 Capacity Auction, which cleared at the FERC-approved cap price of $325/MW-day. This is the third consecutive year the auction has cleared at the administrative cap. Despite the sustained high price signal, the auction was almost 7,000 MW short of PJM’s reliability target.
- With the phase out of safe harbor tax incentives looming, prices for renewable PPA are expected to rise by 40 - 120% , according to level10. Many firms have safe-harbored certain equipment and projects, so market prices do not currently reflect such rates, but this provides an indication of where prices may be going over the next few years.
National Headlines
- SCOTUS Limits Agency Independence: On June 29, the Supreme Court ruled 6-3 that the president can dismiss independent agency heads without cause. This ruling continues the shift toward greater presidential control of the Executive Branch, exposing independent agency decisions, including technical regulations, to political influence.
- 43 Days: That's the new level of total U.S. crude inventory according to Reuters, with the Strategic Petroleum Reserve dropping to a historic low of 311.4 million barrels. This significant reduction from the 65-day average leaves the nation highly vulnerable to global supply shocks and geopolitical conflict.
- Eversource Connecticut Rate Increases on the horizon: Eversource CT has filed for a $503 million rate hike (an 11% average bill increase) starting July 2027 for grid upgrades and storm recovery. State officials are fighting the proposal, citing the utility's high profits, while advocates protest Eversource's request to keep 300,000 pages of the filing confidential.
- No Refunds for ISO-NE Customers: New England consumers won't see refunds for high wholesale transmission charges. According to Akin, FERC recently ruled that ISO-NE Transmission Owners' >9% return on equity over the last 15 years was justified.
- New York’s Data Center Moratorium: New York became the first state to impose a one-year moratorium on new large data centers with peak electricity demand exceeding 50 MW to study their environmental and economic impacts. The pause reflects growing concerns over the strain AI-driven data center growth places on the electric grid.
- DOE’s Nuclear Push: On June 25, the DOE announced bulk funding to target construction commencement of ten 1.1 GW Westinghouse reactors by 2030. To access these funds, partners must commit $1 billion in upfront equity per site. The DOE will select five final host sites from seven potential utility partners. (We covered Westinghouse’s impact in a previous newsletter)
Natural Gas Futures: Playing the Long Game
Years of abundant production and pipeline expansions have kept natural gas prices low and stable for most of the past 10 years. A more recent surge in LNG exports combined with accelerating data center demand are reshaping market dynamics. Coming into view are differing views on price formation early in the next decade. Let’s explore some of the fundamentals that are shaping these outlooks.
Natural Gas Price Outlook
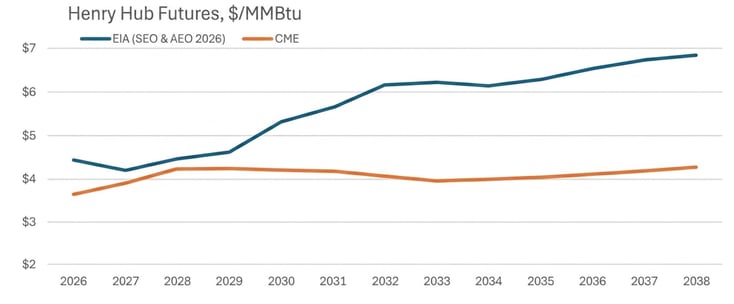
- Strong U.S. natural gas production and healthy storage levels are expected to keep Henry Hub prices relatively subdued in the near term, averaging around $3.50–$3.70/MMBtu through 2026–2027.
- However, the EIA's AEO2026 projects a tighter market over the longer term, with prices rising to $5–$6/MMBtu in the early 2030s as demand from electrification, data centers, and other structural growth drivers outpaces supply. This projection represents a 40-70% increase from current levels and signals a fundamental tightening in market conditions as the 2030s progress. While the market is likely to remain well-supplied over the next few years, the EIA expects that sustained demand growth and infrastructure constraints will support a higher long-term price environment.
Sources: Veolia, EIA, CME
Unprecedented Demand Growth: The Primary Driver
-
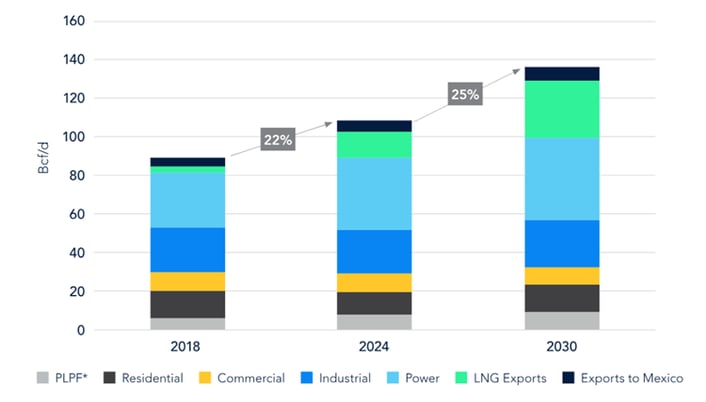
According to the EIA's 2026 Annual Energy Outlook, natural gas demand will surge significantly through 2050, with the power sector increasing 8-43%, industrial consumption growing 11-35%, and LNG exports -the fastest-growing demand source- more than doubling from 2025 levels. Similarly, ICF projects U.S. natural gas demand will accelerate 25% from 2024 to 2030. The two biggest contributors to natural gas demand growth are LNG exports and increased electricity consumption driven by datacenters, as shown in the chart below.
Source: ICF
Plateauing LNG Exports
-
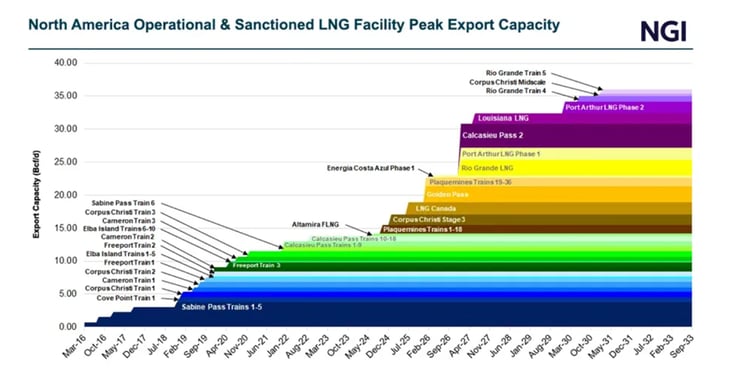
As shown in the chart below, LNG peak export capacity is projected to double between 2025 and 2030. After 2030, there are only a few small terminals scheduled to come online. While there may be more export capacity that has yet to be announced, current forecasts show LNG exports quickly ramping up in the next few years and plateauing around 2030.
Source: NGI
Slackening Data Center Buildouts
- While forecasting datacenter demand has proven difficult, the EIA's 2026 Annual Energy Outlook highlights data centers as the dominant driver of long-term U.S. electricity growth through 2050. BloombergNEF projects data center growth power demand could reach 106 GW by 2035. However, significant headwinds could materially slow buildout after 2030-2035 due to power grid constraints, long construction timelines, cooling limitations, regulatory hurdles, and even industry changes in efficiency or capital availability. Like LNG export capacity, a potential slowdown in datacenter buildout after 2030-2035 could provide some relief for natural gas markets as the most intense phase of AI infrastructure deployment moderates.
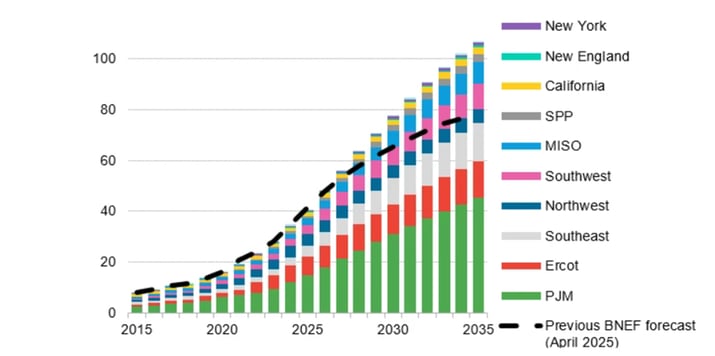
Source: Bloomberg
Promising Production Outlook
-
US natural gas production remains strong at ~108 Bcf/d in 2026 and is expected to continue, reaching 133 Bcf/d -151Bcf/d by 2050 according to EIA. Strong production projections are mainly driven by improved extraction technology and a reassessment of regions with significantly associated natural gas. The reassessment found that the ratio of natural gas to oil in these plays is more strongly weighed towards natural gas than previously believed. Although demand is increasing, production appears to be able to keep pace for the foreseeable future. However, this growth requires pipeline infrastructure expansion, which could create temporary supply constraints if infrastructure lags demand growth, most acutely in the Permian basin over the next five years.
Evolving Power Generation Fuel Mix
-
Electricity generation is becoming increasingly more reliant on natural gas, solar, and wind to meet demand. According to the EIA, these technologies currently provide 60% of the country’s electricity and will increase their share to 80% by 2050. Although the absolute amount of natural gas generation will increase in this time period, its share is projected to remain at 40%. This means solar and wind will be relied on more heavily while natural gas is expected to stay the course.
Summer Peak Update: July's Heat Dome & Capacity Costs
The heat dome that settled over the Eastern U.S. in late June and early July didn't just stress the electric grid, it likely locked in capacity costs for businesses across multiple grid regions. Coincidence between your facility’s Peak Load Contribution and your regional grid’s, is a key variable in planning utility costs and load-curtailment strategies. Ask us about our peak forecasting tools and services at commodity@veolia.com
- For companies in PJM territory especially, July 1st and 2nd almost certainly established two of the five annual "coincident peak" hours that will determine capacity charges for the next delivery year. Predicting peak loads has confronted another complexity this summer: Canadian wildfires. Due to prolonged drought across much of Canada, wildfires are expected to be an ongoing issue this summer. Among other things, the smoke from the wildfires complicates load forecasting. Grid planners and participants struggle to predict the movement, timing, and opacity of the plumes and this has so far had significant implications. “I’ve never seen load forecast errors anywhere near as large as we witnessed during the week of July 12. On July 15, actual peak load came in 4.5 GW short of forecast in NEISO, and that followed a day when there was a 2 GW deviation. This is a significant and unexpected challenge for RTOs” said Doug Hurley from Veolia’s Flexible Energy Solutions division.
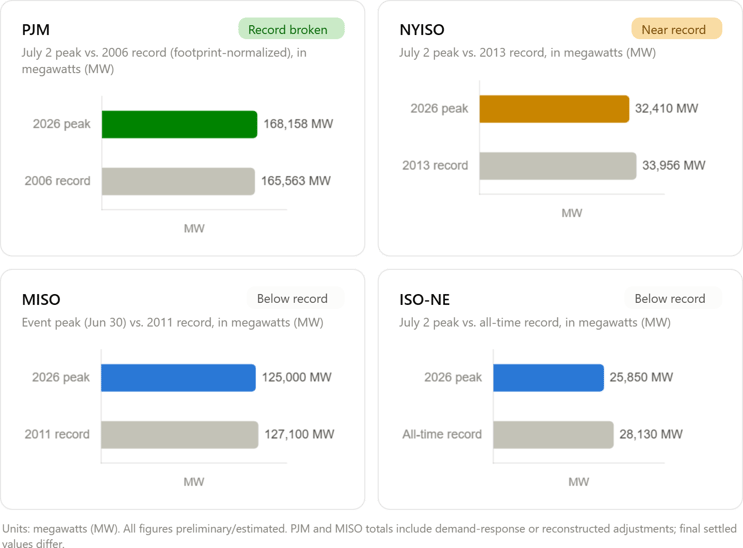
- Here is an overview of peak loads across some major RTOs:
Sources - PJM Inside Lines, Utility Dive, RTO Insider
PJM: Record-Breaking Peak
-
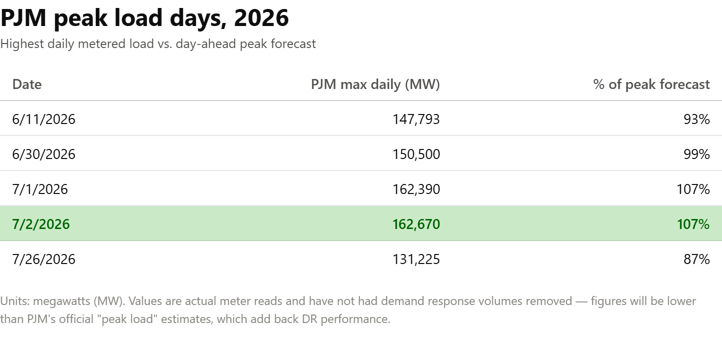
The preliminary peak of 168,158 MW (without Demand Response) on July 2 (5-6 p.m.) broke the 20-year-old record of 165,563 MW. July 1st came in as the second-highest day in 2026 at 161,859 -162,700 MW. These two days will almost certainly count as two of PJM's 5 Coincident Peak (5CP) days for June-September 2026, directly setting your Peak Load Contribution and capacity charges for the June 2027-May 2028 delivery year.
-
The data below captures the most significant load events within PJM territory to date. While these four dates are the current benchmarks for setting your Capacity obligations, they remain fluid and could be superseded by extreme demand spikes occurring through September. Please note that these figures diverge from the regional chart provided earlier as they incorporate Demand Response assets; official verification of these volumes typically requires a 60-day window.
Source: Veolia
NYISO: Strong Candidate for Your Annual Peak Hour
-
Peak demand hit approximately 32,410 MW on July 2, close to but below the 2013 record of 33,956 MW.
-
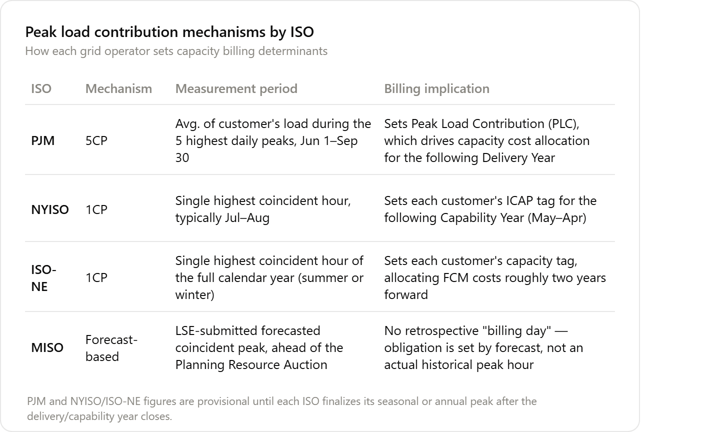
Since NYISO uses a single coincident peak (1CP) methodology based on the highest hour of the entire year, July 2nd is currently the leading candidate for the annual peak. It also gives us a reliable target to calibrate any future peak day events this summer.
-
The region leaned heavily on Canadian hydro imports from Hydro-Québec during peak hours, fully utilizing all 1,250 MW of the newly constructed Champlain Hudson Power Express (CHPE) transmission line
ISO-NE: Below Record, But Still Your Likely Peak
-
Forecast peak of 25,850 MW stayed well below the all-time record of 28,130 MW, and remained below last year’s June 24th peak of 26,551 MW, with no conservation orders needed.
- This event is a plausible placeholder for ISO-NE's 2026 annual peak hour (which determines capacity tags), but the region's year-round 1CP methodology means either a hot August day or even a winter cold snap could still claim that title.
MISO: Operational Stress Without Direct Billing Impact
-
Peak load hit 121-125 GW on June 30-July 2 (highest in at least 10 years of available data), though still short of the 2011 record of 127.1 GW.
- Unlike PJM, NYISO, or ISONE, MISO doesn't retroactively set capacity obligations based on actual peak hours. Utilities and retail power suppliers (Load Serving Entities; LSE) submit forecasted coincident peak demand ahead of the Planning Resource Auction, so this event won't directly reset your capacity charges the way it will in other regions.
Sources - PJM, NYISO, ISONE, MISO - This summer’s heat wave serves as a stark reminder that peak demand is a core pillar of energy cost management. With stacked costs approaching $200,000 per MW-year, your facility’s load management during these few critical coincident peak hours have a direct, significant, and controllable influence on your annual power costs. Implementing real-time meter monitoring, comprehensive curtailment plans, and strategic demand-response participation is the most effective hedge against these increasingly volatile capacity charges. To get more information about our technological solutions to these problems, please reach out to your commodity analyst or commodity@veolia.com.
Changes on the Horizon for Major Carbon Accounting Standards
In late 2025, the GHG Protocol and the Science Based Targets initiative (SBTi) – both widely recognized global standards for corporate carbon accounting – unveiled major proposed revisions that will fundamentally reshape how companies measure, report, and reduce their emissions. These revisions follow recent research indicating that global temperatures are projected to surpass 1.5°C warming within the next five years, as well as advances in data availability and granularity. The rollout of these changes will mark a critical turning point in corporate carbon accounting.
- What are these frameworks? The GHG Protocol is the global standard for measuring and reporting corporate emissions, underpinning major frameworks like CDP and ISSB. SBTi (Science Based Targets initiative) assists companies in setting credible climate goals by providing guidance on target types, timelines, and sector-specific requirements. SBTi validates emissions reduction targets against climate science and offers independent verification.
-
What is the timeline for adoption of these changes? SBTi's V2.0 standard is already finalized, while GHG Protocol changes are still under consideration and are expected to be finalized in 2028. SBTi V2.0 will be available for target validation beginning February 1, 2027, with supporting resources launching at that time. V1.0 will remain open for target submission until the end of 2027, after which all companies are required to use V2.0.
Major Changes At A Glance
|
Category |
GHG Protocol (Under Consideration) |
SBTi Version 2.0 (Final) |
|
Scope 1 Emissions |
— |
1. Scope 1 will now have a standalone target (previously was combined with Scope 2) with 100% coverage required.
2. Introduces new decarbonization pathways: linear contraction, asset decarbonization, or alignment-based (e.g., pairing carbon capture with natural gas). |
|
Scope 2 Emissions |
1. Shift from annual to hourly & location-based measurement
2. Mandatory location-based and hourly REC matching
3. Introducing hierarchy of emission factors
4. Supplemental consequential method using marginal emissions data |
1. Relaxing standard from requiring “zero-carbon” to now “low-carbon” electricity (≤0.048 kg CO₂/kWh, tightening to 0.024 in 2035)
2. Mandatory location-based REC matching
3. From 2030 onward, mandatory for large consumers (≥10 GWh) to hourly-match RECs
4. RECs must be generated from facilities that came online or repowered within the last 10 years, narrows to 5 years by 2035 |
|
Scope 3 Emissions |
1. Mandatory reporting of significant emissions categories (>5% threshold) 2. Disaggregation of spend-based vs. activity-based data required |
1. Focus on significant categories (>5%) and priority sources (industrial commodities, fossil fuels, electrified products) |
Practical Implications: What Do These Changes Mean?
-
The largest impact under both frameworks are the significantly tightening Scope 2 measurement and reporting requirements. While well-intentioned, these changes create real operational barriers:
Increased RE Procurement Complexity & Cost
- Requiring renewable energy to match consumption by location and hour forces companies with distributed operations to negotiate separate PPAs in each region. This is costly and counterintuitively may discourage investment in the “dirtiest grids” with the most challenging markets, which would have the highest renewable impact. Buyers may shift toward short-term spot purchases as a result, abandoning long-term PPAs that have proven most effective for large-scale decarbonization over 10+ years
Infrastructure Constraints
- Hourly matching requires metering infrastructure, administrative capacity, and data systems most suppliers and consumers lack. Large buyers managing multiple sites and contractual instruments face particular challenges.
- Supporting systems such as central registries and hourly trading exchanges remain underdeveloped.
What about existing contracts and targets?
-
SBTi: Existing validated targets remain fully valid throughout their target cycle (subject to 5-year review provisions). Companies with renewals due in 2026-2027 should submit targets using Version 1.3.1, which remains open through the end of 2027. V2.0 becomes mandatory from 2028 onward.
-
GHG Protocol: The GHG Protocol is considering grandfathering provisions for existing market-based agreements and is currently weighing stakeholder input on eligibility criteria (project type, term length, etc.). Final details on grandfathering and eligibility are forthcoming.
-
With these changes on the horizon, our team is closely monitoring updates from both GHG Protocol and SBTi ahead of these revisions being rolled out.
Introducing the Veolia Energy Markets National Risk Matrix for August
Before signing off for our August publishing break, we're sharing the simplified market matrix to summarize some of the key drivers of wholesale electricity and natural gas prices. Each event is scored on a 1–5 scale for both:
- Probability: how likely the event is to occur, with 3 being equal weighting, and;
- Market Impact: its expected effect on energy prices, with 3 being moderate and 5 representing the highest impact.
|
August Driver |
Probability |
Impact |
Primary Market Exposure |
|
🔥 Extreme Heat |
3 |
3 |
Power & Natural Gas |
|
🌍 Iran War Entrenchment |
3 |
4 |
Oil (Brent, WTI) |
|
⚡ Grid Reliability Issues |
1 |
3 |
Wholesale Power (regional) |
|
🌀 Hurricanes |
1 |
4 |
Natural Gas & LNG |
|
🪙Economic Downturn |
2 |
5 |
Demand, Commodities |
Created by Veolia
See you in September!
Market Data
Market data disclaimer: Data provided in the "Market Data" section is for the newsletter recipient only, and should not be shared with outside parties.