Energy Markets Update
Weekly natural gas inventories
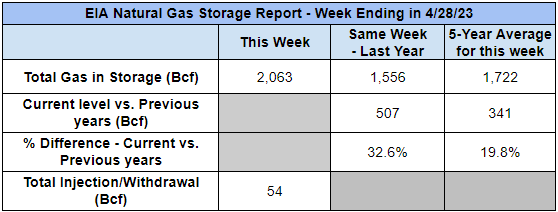
The U.S. Energy Information Administration reported last week that natural gas in storage increased by 54 Bcf. The five-year average injection for April is about 47.5 Bcf. Total U.S. natural gas in storage stood at 2,063 Bcf last week, 32.6% higher than last year and 19.8% higher than the five-year average.
US power & gas update
- US natural gas futures traded mostly flat over the last two weeks with prices slumping 6% to a one-week low last Wednesday. This comes on the heels of two new gas rigs starting production and a number of LNG plants temporarily shutting down for spring maintenance.
- NG ‘23 prompt-month NYMEX settled at $2.32/MMBtu and prompt pricing for June has climbed ~$0.18 thus far. The 12-month strip is trading up $0.08 while further out, Cals ‘29-’35 are moderately trending downward.
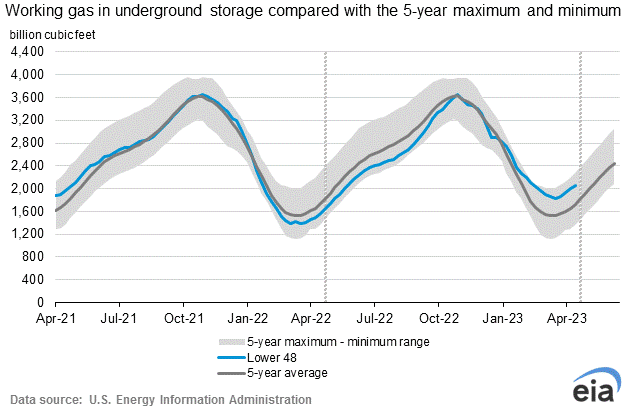
- Despite tightening spot prices, by and large the market is struggling to recover from winter’s record production and a weak heating load demand that’s amassed a surplus of gas in storage, which stands 32.6% higher than last year.
- Regional markets lost ground last week as a burst of late-season heating demand out West began tapering off. This lull is supported by weather forecasts that expect recent chilly temps on the West coast to renormalize, with mild weather in the Midwest and Eastern US to come.
- Early summer forecasts show widespread warm weather getting a late start this year.
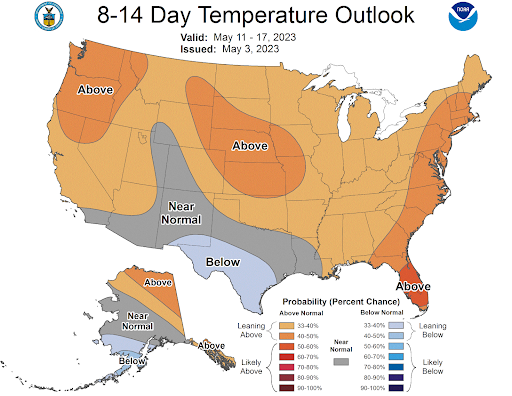
Source: NOAA
- The real question – how low can natural gas go? – continues to loom on analysts’ minds. Last month’s record-high US gas output in the Lower 48 (peaking at 101.3 Bcf/d) widened the gas surplus even further and prices continue to bottom out.
- Amid this year’s 70% price drop NG producers are banking big-time on the recently reopened Freeport LNG terminal to turn it around.
- Voluntary REC markets are showing some volatility after trading sideways for the past 18 months. National wind REC prices fell dramatically last week and have since rebounded.
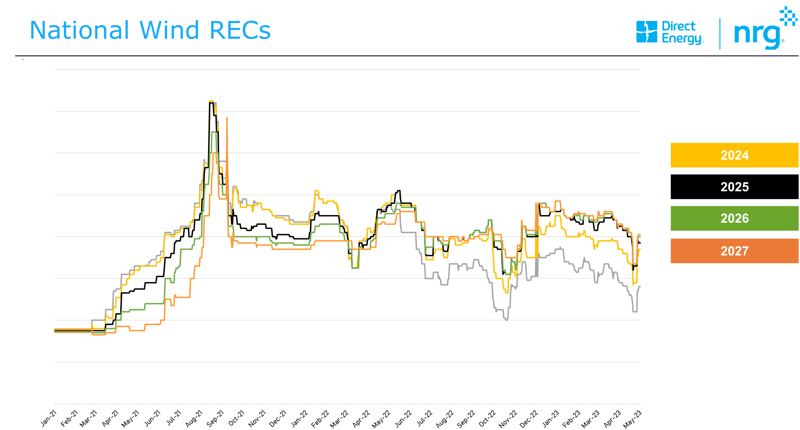
Source: Direct Energy / NRG
Amid a series of physical attacks on the grid, FERC is prepared to take action
- Physical attacks on the North American power grid rose more than 10% in 2022. As a result, Federal Energy Regulatory Commission (FERC) acting chairman Willie Phillips pledged to hold a technical conference to address potential changes to the grid’s physical reliability standard. This all comes in response to the significant uptick in attacks on substations and other critical grid hardware in the past year.
- FERC approved the physical security reliability standard back in 2014 to enhance physical security measures for Bulk Power System facilities that are deemed critical, to lower the overall vulnerability of the grid to physical attacks. Due to the nearly 1,700 incidents reported in 2022 FERC has decided changes may be necessary to maintain grid reliability.
- During FERC’s April 20th open monthly meeting, North American Electric Reliability Corp. (NERC) President and CEO Jim Robb, highlighted recommendations for enhanced recovery options and further standardization of substations and critical equipment. This was outlined in RD23-2, a report filed with FERC six days prior to the meeting.
- Robb suggested expansion of the Electricity Information Sharing and Analysis Center (E-ISAC). E-ISAC, operated by NERC, sets the mandatory reliability standards for the U.S. electric utility industry and aims to increase transparency on threats to the power grid.
- E-ISAC was created in response to the December 2022 attacks on two North Carolina substations which disabled parts of the state’s grid for several days. These attacks prompted FERC to ask NERC for an assessment of the adequacy of their physical protection reliability standard.
- Potential solutions outlined in RD23-2 to reconfigure transmission systems with the goal of achieving higher systemic resilience in the event of future attacks were also addressed during the April 20th FERC meeting. FERC accepted a pending proposal from PJM to change the capacity values of renewable energy resources bidding into PJM capacity auctions.
NY becomes first state to ban natural gas stoves in new construction
- Late on Tuesday, New York took major strides toward state-wide electrification by passing legislation requiring all-electric heating and cooking in new construction buildings (those under 7 stories by 2026, and taller buildings by 2029).

- This ban supports New York’s aggressive net-zero by 2040 goal, both of which are reflective of a recent nationwide push to cut building emissions and electrify homes.
- Climate activists remain skeptical that this legislation will become law, fearing legal pushback from fossil fuel companies. Recently a similar gas ban in Berkeley, CA was nixed by the U.S. court of appeals 9th circuit (a move sponsored by oil & gas giants), leading some to question whether NY’s ban will survive.
- Because the ban also extends to oil and propane heating, critics worry that restricting consumer choice and pushing households toward electricity – which costs more than natural gas in most of the state already – will increase utility bills.
- Even so, supporters of the ban have hope for a smooth transition as NY plans to increase the state’s clean energy capacity and production (particularly wind, solar, and hydro) exponentially over the next few years.
- Even so, supporters of the ban have hope for a smooth transition as NY plans to increase the state’s clean energy capacity and production (particularly wind, solar, and hydro) exponentially over the next few years.
PPUC directs PGW to justify rate increases for residential customers, 1000% rate increase for Philadelphia steam loop operator
- On February 27th, Philadelphia Gas Works (PGW), a natural gas utility in the Philadelphia area, filed a rate case with the Pennsylvania Public Utility Commission (PPUC). This proposed change would increase annual revenue by approximately $85.8 million, an increase of 10.3%. The customer charge would also rise from $14.90 to $19.50 alongside other rate based increases.
- In addition to this rate hike, PGW is fighting to keep their 1000% rate increase for delivery to the current owner of Philadelphia's steam loop, Vicinity. Vicinity operates a plant in Grays Ferry that produces the steam that is fed into the city loop, powered by natural gas from PGW.
- Vicinity claims this increase would squeeze them and could prevent them from producing steam by thermal energy from the Schuylkill River as planned.
- Vicinity was notified of the increase in February 2021 and filed a complaint in October 2021 alleging that PGW was behaving in a way that was predatory and anti-competitive. Vicinity offered to buy the pipeline that feeds into its plant for $10 million, but was rebuffed by PGW.
- This case was heard by an administrative law judge who ultimately concluded that PGW’s rate increase was reasonable. Vicinity then appealed this decision to the PPUC. PGW has argued that Vicinity’s costs are subsidized by the rest of the population, while the PPUC rejected this argument since it directly contradicts their previous stance on prior rate increases.
- Vicinity’s CEO, Bill DiCroce, also claims that PGW is trying to steal Vicinity’s customers by decreasing the cost of gas boiler installations. A couple of large customers, Independence Hall and the 30th Street Amtrak Station, have already decided to swap to PGW.
Capacity tags, an overview
- With summer swiftly approaching, many North American companies are preparing for the annual cooling season. Bills during this time of the year are primarily driven by elevated volumetric consumption to support air conditioning loads, there is a less obvious but equally important capacity charge set during the summer that factors into electric costs for many customers year round.
- This concept has varying names across regions, but energy purchasers have likely heard of something along the lines of Capacity Tag (“Cap Tag”) or Coincidental Peak (“CP”) Contribution. These terms refer to the kilowatts (kWs) of demand on the building’s meters during the peak or a series of peak hours on their respective grid annually. The rules and make up of this charge vary between Independent System Operators (ISOs) and Regional Transmission Organizations (RTOs), however they are all generally complex in design and share similar traits. These programs provide each regional grid with stability and a billing model that is fairly representative of the costs each customer is accountable for when the grid is most constrained.
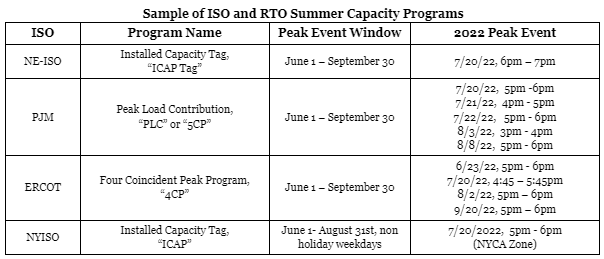
- A high level summary of different Capacity programs and their attributes is shown in the figure below.
- To further illustrate this concept, look at the New York Independent System Operator (NYISO) ICAP program. This program affects customers of the ConEdison utility in New York State. NYISO combines all the ICAP tags from customers across the state to forecast the electricity generating capacity, with some additional reserve capacity, that is required to keep up with demand on those peak days.
New York Statewide Resource Availability and Planning - Summer 2022
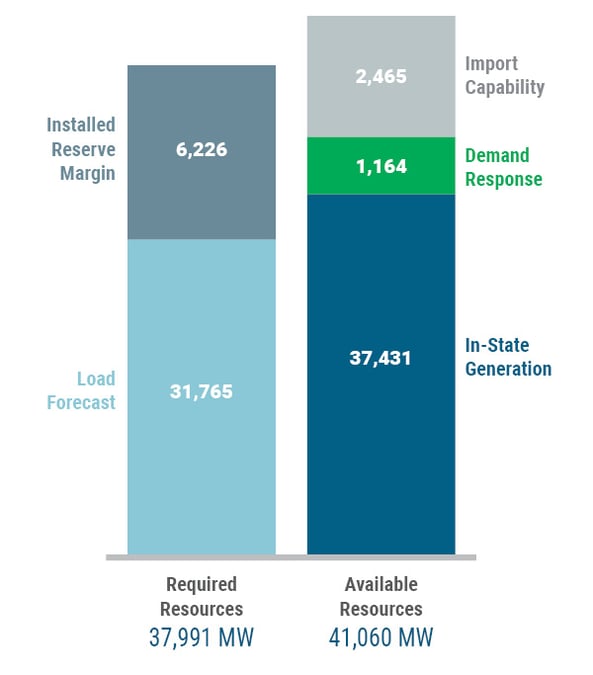
Source: NY-ISO
- Typically, the electricity grid in New York City (NYCA) hits its peak demand late in the afternoon during the hottest summer days. The chart below illustrates that during the summer, the system peak usually occurs between 5:00 and 6:00 PM. The peak window is expected to move later as the region continues to electrify its building stock.
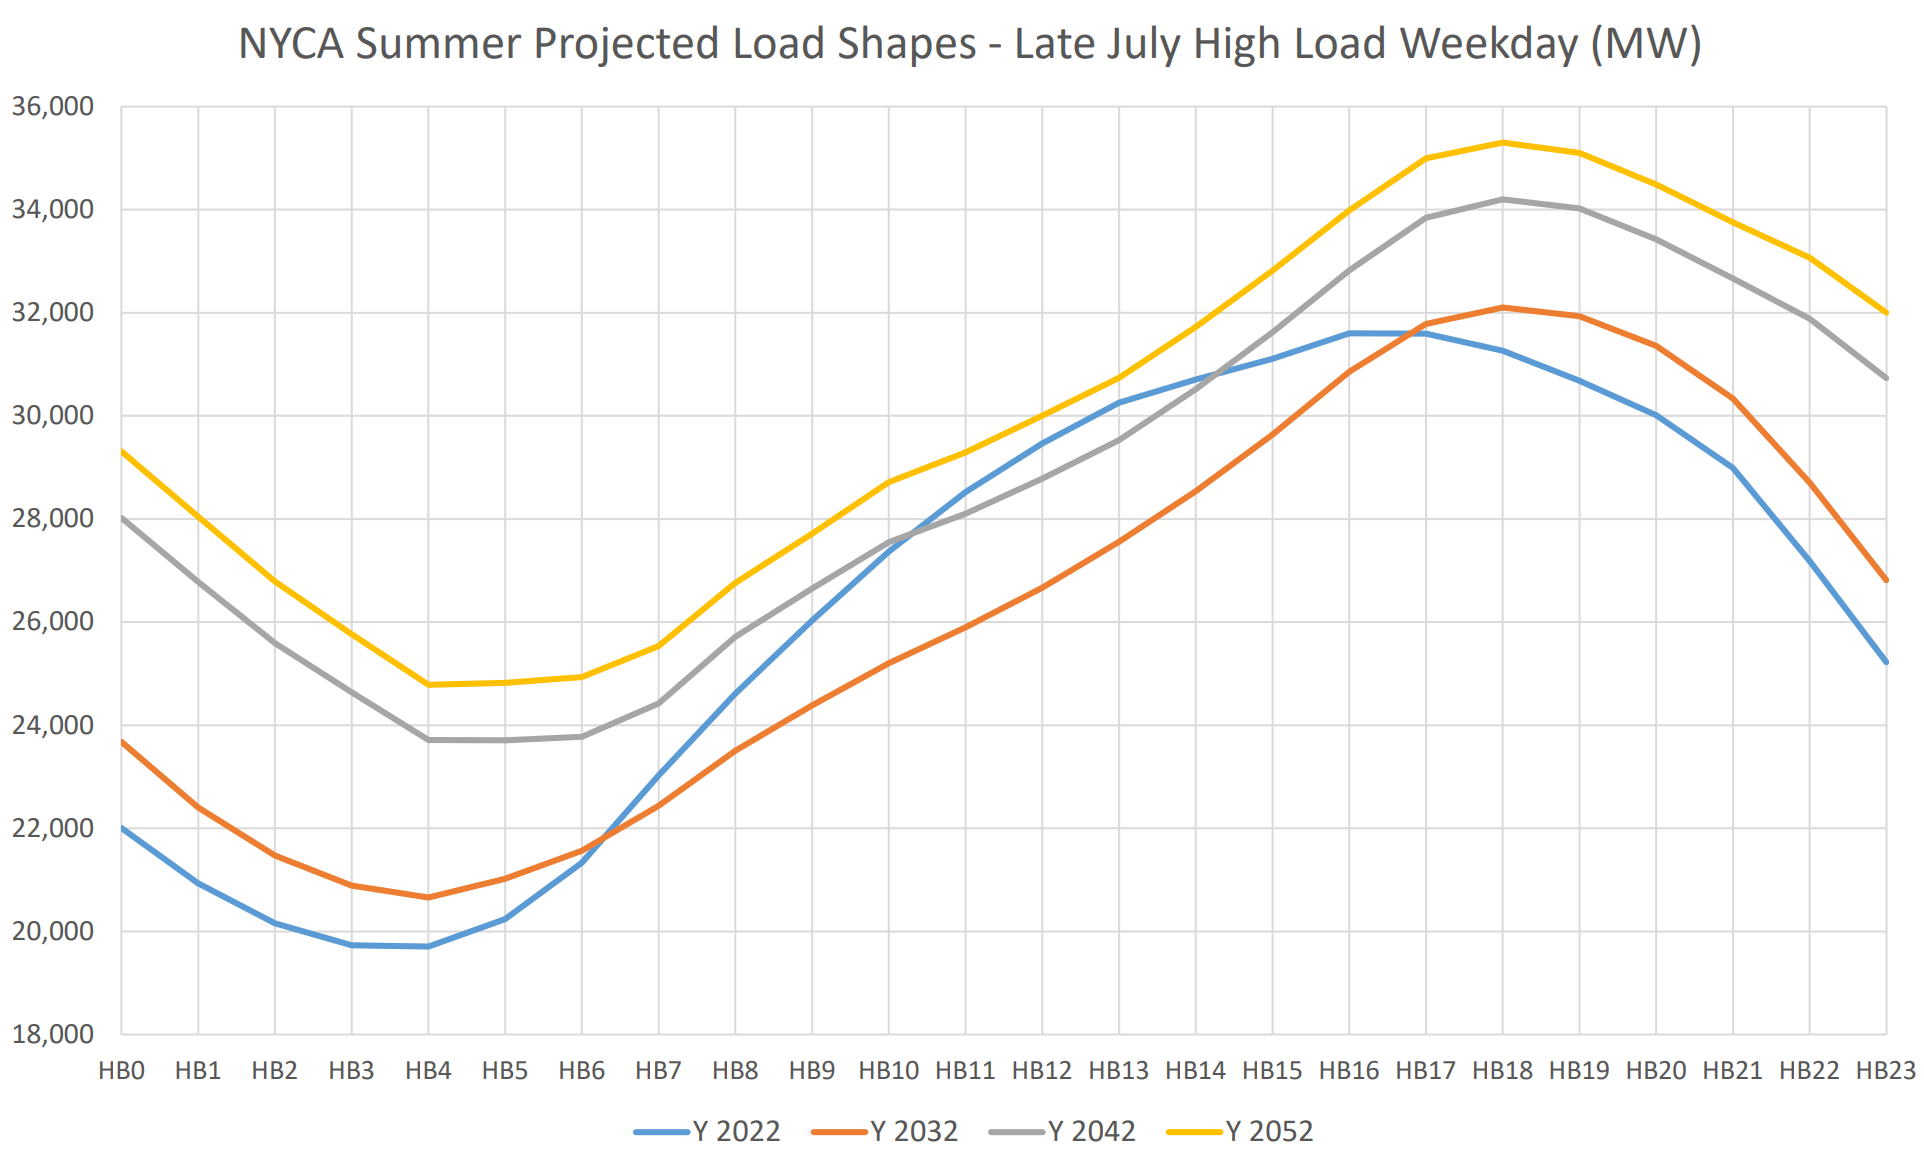 Source: NY-ISO
- “Tags” are revised annually meaning each building has an opportunity to improve or hurt its future energy costs from activities taken during these events. Proper planning and communication with building occupants to take steps to reduce electricity usage during these peak events can reduce or completely eliminate tags.
- In our next Newsletter we’ll continue this discussion with a focus on strategies that facility managers can utilize to reduce their building’s future Tags and operating costs across all ISOs.
Natural Gas Storage Data
Market Data
Use the filters to sort by region
Market data disclaimer: Data provided in the "Market Data" section is for the newsletter recipient only, and should not be shared with outside parties.