Energy Markets Update
Weekly natural gas inventories
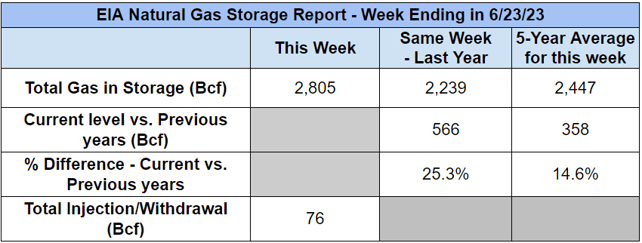
The U.S. Energy Information Administration reported last week that natural gas in storage increased by 76 Bcf. The five-year average injection for June is about 82.8 Bcf. Total U.S. natural gas in storage stood at 2,805 Bcf last week, 25.3% higher than last year and 14.6% higher than the five-year average.
US power & gas update
- Gas and power markets traded mostly sideways throughout the month of June. That is to say, spot prices remain excessively weak while premiums persist in a “contango” forward market, i.e., higher prices as you go further out into 2024 and 2025.
- The market is still weighing two fundamental questions: (1) how will a declining rig count manifest in tapering of gas supply, and (2) will summer demand be enough to push the market out of balance?
- Weather thus far has been mixed: excessive heat in Texas and Southwest was balanced by modest temperatures across much of the Northeast throughout June. Forecasts point to a modest warm up in the first couple of weeks in July…and potentially more rain in the East.
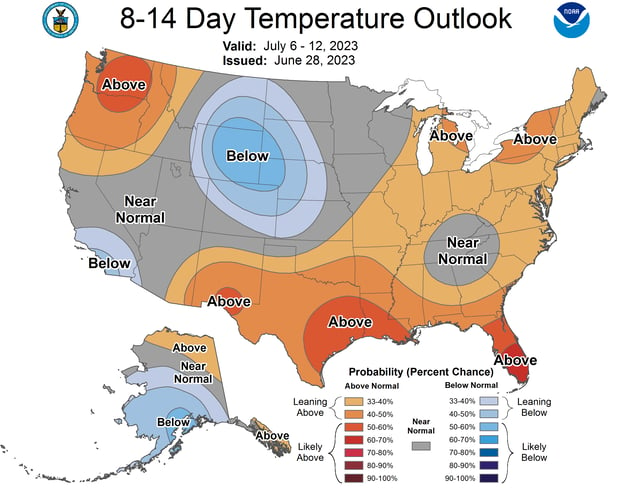
Source: NOAA
- The market will become tighter when Sabine Pass LNG finishes its first major 6-year maintenance cycle this week. It will begin exporting another 3 bcf/d, which has been mostly offline since the start of the month.
- The natural gas rig count, a leading indicator of changes in supply, is down about 10-15% (20 rigs) since April, the first notable reduction since Q2 of 2020. All said, this bodes for price strength in late 2025, perhaps earlier.
- FERC recently approved PJM’s request to delay its capacity auctions (yes, again) for the 2025/26 through 2028/29 delivery years. The auction previously scheduled for this month will be postponed until June 2024, with subsequent auctions to be held every six months until PJM gets back on the three-year-ahead schedule. The most recent auctions had been trending lower. Buyers can still hedge through the bilateral market, however this may imply larger spreads between vendors.
- Summer capacity prices in New York City remain at multi-year highs. Customers should anticipate strong prices for the remainder of the summer, adding roughly 2-4 cents per kWh to the price stack year-over-year.
ERCOT supports record electricity demand in June
- On Tuesday (6/27), Texas’ power grid broke its own record for the all-time high demand, reaching a peak of 80,875 MW. This surge coincided with many parts of the state steaming in triple digit temperatures. Prior to Tuesday, the record stood at 80,148 MW, which was set last July.
- During this record-breaking uptick, the Electric Reliability Council of Texas’ (ERCOT) demand dashboard stated that the grid still had almost 7,000 MW of operating reserve power still available, a significant stock compared to past instances of record energy draws.
- ERCOT continues to anticipate high demand in conjunction with sufficient available capacity as temperatures remain in the triple digits for the remainder of the week. See ERCOT’s forecast below.
Demand and available capacity forecast for ERCOT June 29- July 4th 2023
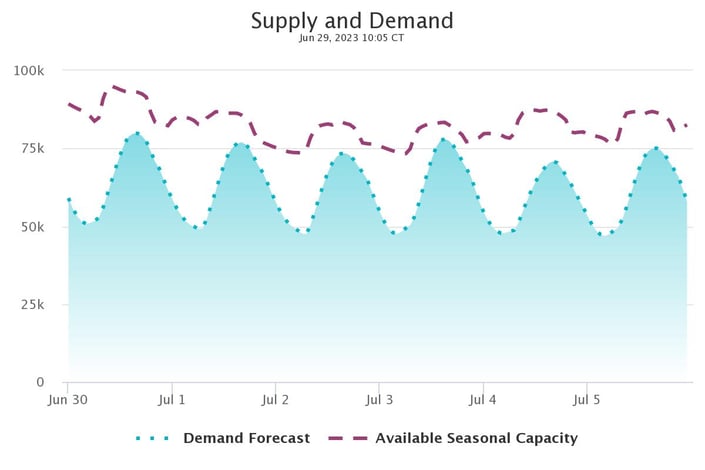
Source: ERCOT
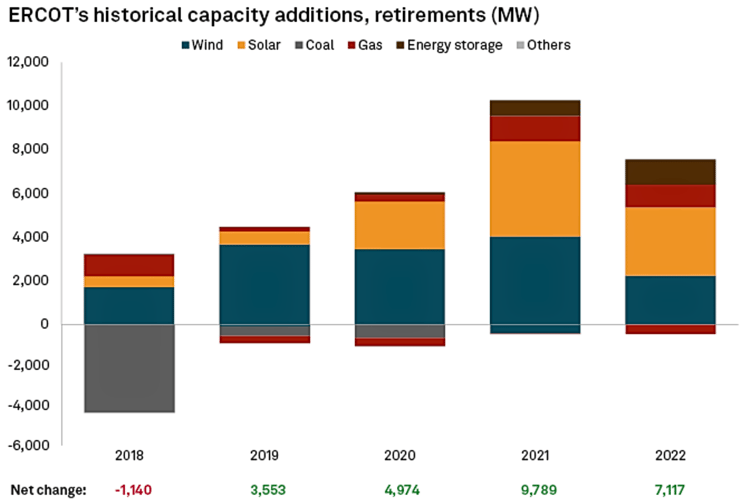
- The successful management of ERCOT’s grid balancing response to ever increasing peak demand is the result of new measures which stemmed from ERCOT’s Feb 2021 grid failures, and prompted capacity additions around the state.
ERCOT's 2023 capacity additions
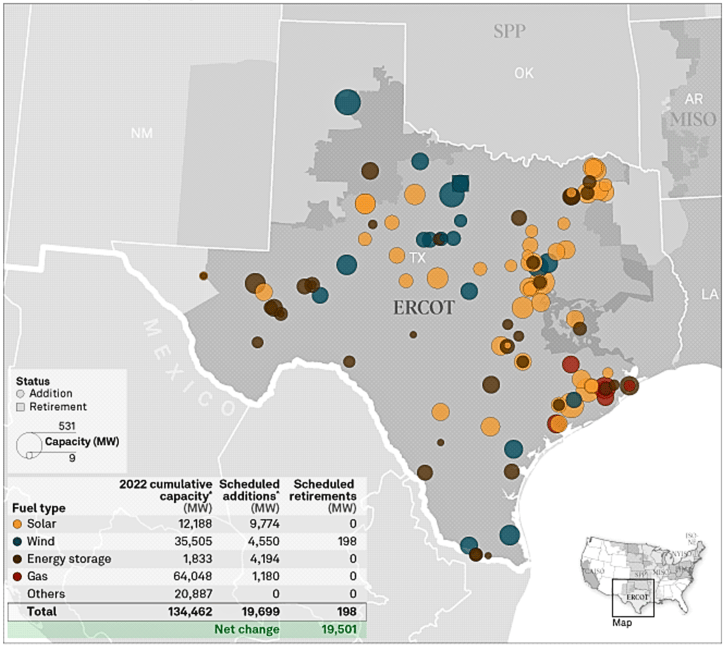
Source: S&P Global Market Intelligence
- While solar and wind made up 7% and 31%, respectively, of the state’s electric power this year, there is still debate between state politicians, some of which criticize the heavy focus and investment in renewables which are intermittent in production, notably during demand peaks.
- A solution to balance demand with intermittent renewable resources includes deploying batteries which store the renewable power when it isn’t needed by the grid, during times of high stress. Most of the 38 storage projects planned to be installed in Texas in 2023 will be co-located and paired with solar installations, according to the S&P Market Intelligence data.
Source: S&P Global Market Intelligence
- In any event, ERCOT is facing mounting challenges associated with managing peak load in both the summer and winter seasons. Many cities across Texas are facing an increasing frequency of 100 degree days and it is difficult to design systems that operate optimally in both extremely high temperatures, and sub zero temperatures as well.
Blowin’ in the wind: peril in the offshore wind industry
- The offshore wind industry is poised for explosive growth over the next decade; however, significant obstacles threaten to derail its lofty ambitions including major economic, legal, and workforce development issues.
- Recent setbacks include a growing number of suppliers seeking to renegotiate prices or abandon projects they have already committed to.
- The news is not all bad. The 800 MW Vineyard Wind project off the coast of Martha’s Vineyard (MA) began construction this month and could begin commercial operation by the end of 2023. It would be the first major project in the US and a major proof of concept for an industry that has struggled to convert plans into reality. Just this week NYISO approved a 3000 MW offshore wind transmission project from the New York Power Authority.
- The East Coast states currently have about 25 GW of offshore wind projects under various stages of development.
- Many states in the Northeast are also tying the fate of their renewable energy targets to the offshore industry, including New York which expects 9,000 MW by 2030 and Massachusetts, which recently upped its target to 5,600 by 2030. Put simply, there is a lot riding on offshore wind: carbon goals, economic growth, and even power system reliability as the region simultaneously regulates thermal plants out of existence.
Offshore Wind Planning Areas, Lease Areas, Operational Installations & Projects in Review
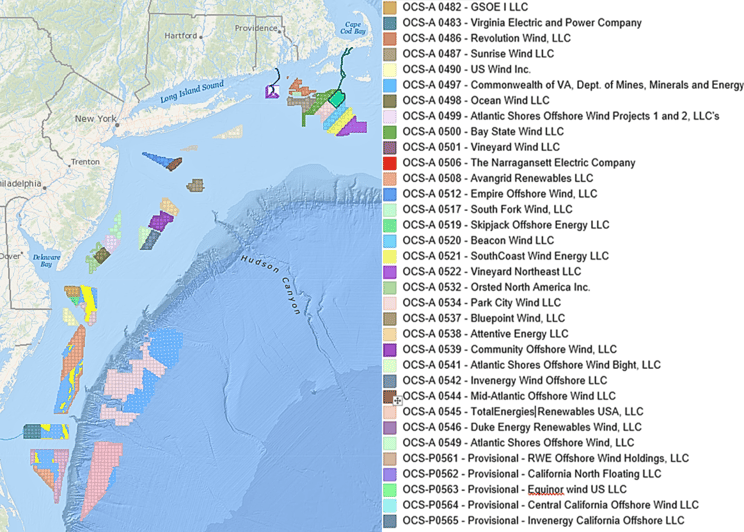
Source: Northeast Ocean Data
- Major Headwinds: for now, the industry remains largely unprofitable. Many of the market leaders, including Siemens Gamesa, have been losing billions with no end in sight. The major Western turbine-makers increased prices of their turbines by more than 30% in 2022, from 2020 levels, but it may not be enough.
- A troubling number of previously contracted projects are already getting cold feet due to higher interest rates and looming supply chain issues. This trend draws into question the viability of thousands of MWs of capacity that were anticipated over the next 6 years.
- This past December, Commonwealth Wind, the 1.2 GW Avangrid-backed project, pleaded with Massachusetts to release it from its $72/MWh price offer signed with the MA utilities just 6 months earlier.
- SouthCoast Wind, a partnership between Shell Energy and Ocean Winds, sought to withdraw a pair of contracts signed with the state of Rhode Island in 2019 (800 MW) and 2021 (400 MW).
- Just weeks ago in New York, Empire Wind 1 (800 MW) and 2 (1.2 GW) and Beacon Wind 1 (1.2 GW), also filed a petition with the NY regulator seeking increased prices, indicating that the “real returns on each of the Projects have fallen far below the range that can reliably attract the investment necessary to move forward.”
- Regulators and state authorities will be under increased pressure this year to keep their pipelines intact, but this will be a challenge. The industry faces both cost pressures, as well as labor and materials pressures. There are only a small number of vessels in the world equipped to place the massive monopiles that support offshore turbines. The industry will need to scale labor and materials at a maddening pace, and this will likely result in additional delays. Ultimately, many of these price negotiations with faltering vendors will ultimately be drawn out in litigation.
- We look forward to the commencement of Vineyard Wind in the near future, but regulators might want to keep those thermal plants in service until the monopiles are hammered in.
Cambridge’s BEUDO legislation; what does it mean for your business?
- Cambridge has long been planning to expand and codify an aggressive net zero ordinance that was first outlined in 2014. On Monday, June 26th, the Cambridge City Council voted a new, expanded version of this ordinance into law.
- Reporting for building usage and renewable purchases must be reported by May 1 annually for the prior year. Many buildings have already been doing so but the new ordinance has teeth for non-compliant owners.
- There are numerous rules and regulations that building owners must follow starting in 2025. Building owners are responsible for all emissions from their building, even if they have tenants.
The baseline usage for buildings under the BEUDO ordinance is the average annual usage from 2018-2019.- For buildings built after 2019, the baseline will be the average of the first two years of complete usage following the completion of construction.
- Buildings can request an alternative baseline for two years between 2010-2011 and 2018-2019. This request must be submitted prior to the initial compliance period and will be the permanent baseline moving forward if approved.
- There are different, more stringent requirements for buildings who use a different baseline time period.
- Requirements also differ depending on the size of the building.
- For buildings under 100,000 sqft, there are no immediate emissions requirements. Starting in 2030 they are required to reduce emissions by 40% with an additional 20% in reductions required every five years until net zero is achieved in 2050.
- Buildings over 100,000 sqft are required to reduce emissions by 20% starting in 2025, and an additional 40% every five years until they reach net zero in 2035.
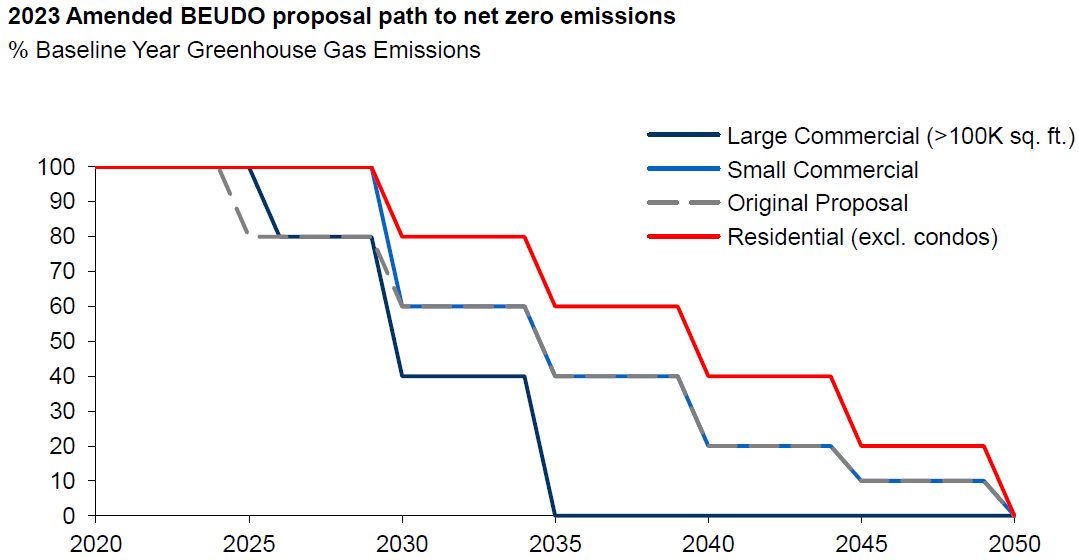
Source: City of Cambridge
- To help reach this goal, Cambridge allows for Renewable Energy Credits (RECs) to be used to offset electric usage.
- RECs can be purchased from a variety of marketplaces, but only certain RECs can be used to offset emissions under this ordinance.
- To comply with this ordinance, RECs must be retained from projects with additionality. Additionality means that it is a new project that would not be built without the investment of the building owner.
- Grid emissions factors and emissions factors for other fuels will be determined and can be accounted for by building owners.
- Cambridge will be setting up a community aggregation rate, an electricity supply program, which residents and building owners can sign up for to receive 100% renewable energy. A carbon fund will also be set up to give owners another option to help reduce carbon.
- Carbon offsets, an environmental attribute used to offset natural gas emissions, can be used by building owners, but only for buildings greater than 100,000 sq ft and only up to designated thresholds for compliance periods.
- 2025-2029: Carbon offsets are not allowed
2030-2034: Offsets can cover 20% of building usage
2035-2039: 40% of usage can be covered by offsets
2040-2044: Only 20% of usage can be covered
2045+: Offsets are again not allowed.
- 2025-2029: Carbon offsets are not allowed
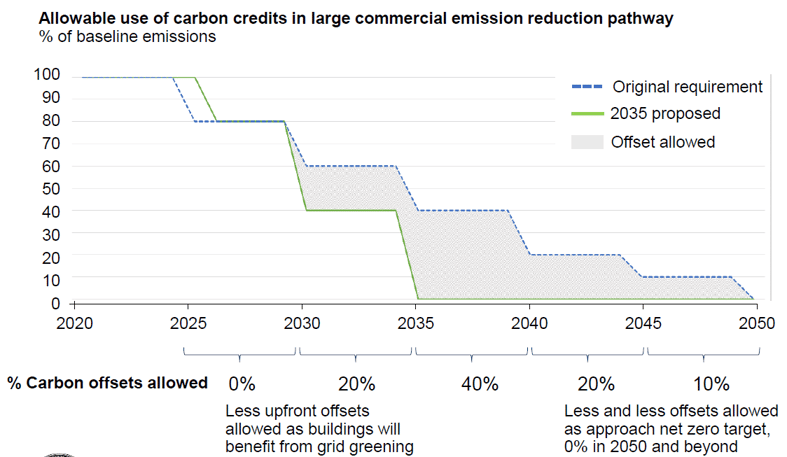
Source: City of Cambridge
- According to the ordinance, carbon offsets must be local. Local in this case is Cambridge, then Massachusetts, then New England depending on what is available. Offsets must also follow the PAVER+ criteria (Permanent, Additional, Verifiable, Enforceable, Real reductions, co-benefits, environmental justice).
- Ultimately, owners that do not comply with the carbon reduction maximum thresholds can purchase Alternative compliance credits at $234/MTCO2. These will be charged to owners who do not meet ordinance requirements.
- There are still a number of details that need to be finalized for building owners to determine how exactly they will comply and those will be rolled out in the coming months and years.
- A policy review is scheduled to take place by May 1, 2028 as part of the ordinance to determine how the program is going and any changes that need to be made moving forward.
European energy markets shrug off Russian coup attempt
- Political turmoil in Russia has had profound ripple effects on European energy markets over the past 18 months. The recent attempt by the Wagner mercenary group to apparently overthrow the Russian government, despite being defused for now, has added a new risk into this already-volatile market.
- The market has calmed for now but traders are bracing for any signs of further instability that could affect the country’s oil and gas production and exports. Europe was fortunate to have such a mild winter this year. The region is likely to see higher prices later in the fall as it tops off inventories.
Energy markets felt European political turmoil in 2022 (index: 23 February 2022 = 100)
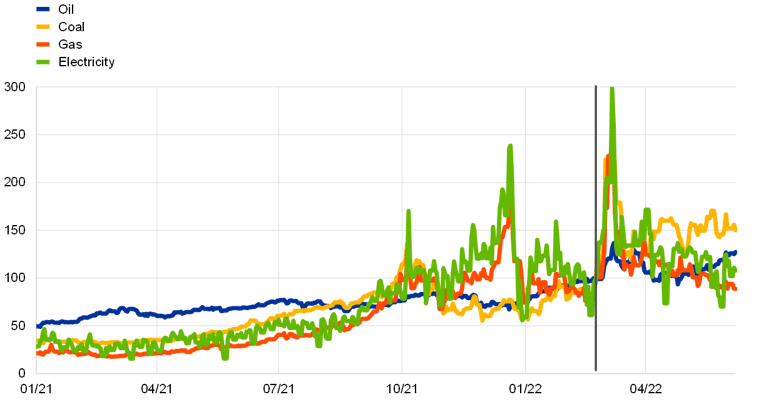
Source: ECB
- Ukrainian power provider DTEK, the nation’s largest producer, is targeting recovery of 25% of its lost thermal power generation by October. Russia began ramping up attacks on critical infrastructure, including thermal plants and transmission lines about 6-8 months ago.
- Ukraine's lost capacity includes the Zaporizhia nuclear power station, which accounts for around 40% of total nuclear capacity. DTEK itself lost about 50% of its thermal power generation capacity. DTEK aims to bring 1.4GW of capacity back online, which will cost an estimated $150 million. It is aiming to secure the funding from one of Ukraine's state-owned banks by early July.
- Ukraine's lost capacity includes the Zaporizhia nuclear power station, which accounts for around 40% of total nuclear capacity. DTEK itself lost about 50% of its thermal power generation capacity. DTEK aims to bring 1.4GW of capacity back online, which will cost an estimated $150 million. It is aiming to secure the funding from one of Ukraine's state-owned banks by early July.
- DTEK also plans to increase gas production and exports. In 2022 its gas output was 2 Bcm. Ukraine also has a storage capacity of 30 Bcm, at least 10 Bcm of which can be used to support European markets. Ironically, Russia still exports significant volumes of gas through Ukraine. The Sudzha entry point is the only access to central and western Europe (Nord Stream and Yamal-Europe are offline).
Major Russian gas pipelines to Europe

Source: Samuel Bailey
- Among the geopolitical turmoil, Russia has lost most of the European gas market it built up over decades. It was estimated in 2017 that $100 billion had already been invested in the development of gas reserves on Russia's Yamal Peninsula, most of which were tied to Europe through pipelines, including those running beneath the Baltic Sea linking Russia to Germany. That figure was expected to double by 2025. Much of that investment now looks redundant.
Summer ISO grid preparedness
- With summer in full swing, ISO’s are bracing for soaring temperatures and peak demand. With periods of high stress on the grid being inevitable during summer months (that heatwave plowing through TX – here’s lookin’ at you), ISO’s must ensure adequate power generation to support customer demand.
- PJM currently serves 65 million customers across 13 states. Their forecasted peak grid demand is estimated at 156,000 MW this summer. PJM has over 186,000 MW of installed generating capacity and is expected to uphold reliability.
- PJM has incorporated more unlikely, extreme scenarios into their forecast models following winter storm Uri in 2021 that caught the ISO off-guard.
- Modeling of these “extreme” conditions has indicated tightening reserve margins. To mitigate the impact, PJM has stated that demand response programs (i.e. encouraging customers to voluntarily reduce their load during peak load hours) will be key.
- ISO-NE is expected to have sufficient capacity under typical summer conditions this year. Demand is expected to peak at 24,605 MW and over 30,000 MW of capacity will be available to meet consumer demand.
- ISO-NE’s forecast accounts for the demand-reducing effect of energy efficiency resources and behind-the-meter solar photovoltaic installations, which have a combined generating capacity of 2,884 MW.
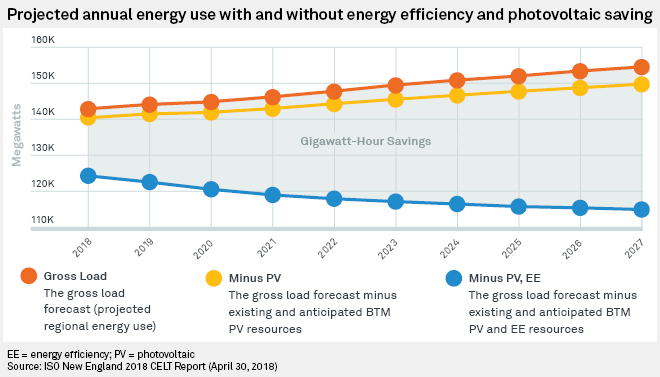
Source: ISO-NE
- If extreme conditions do lead to higher-than-expected demand, ISO-NE has multiple measures to fall back on: importing emergency power from regions closeby, power system reserves, and demand response programs to name a few.
- NYISO expects more grid reliability issues than its fellow ISO’s in coming years. The operator’s latest reliability assessment concluded that the ISO will struggle to meet increased demand this summer, and a new assessment scheduled for release in July will likely propel this narrative into future years.
- The NYC area will struggle most due to limited generation and transmission to serve high demand.
- The real crisis will take effect summer 2025, as many peaker plants are being retired in New York due to new climate-friendly legislation.
Natural Gas Storage Data
Market Data
Market data disclaimer: Data provided in the "Market Data" section is for the newsletter recipient only, and should not be shared with outside parties.